


The Charts and Numbers
Should we keep cheering about how great the stock market is doing? Or should now be the time we start paying attention to the numbers and the way some of these graphs look?

We personally (we being The Simple Side team) think the economy has several (4ish) years left of good times before the fan changes direction and starts blowing right back in our face. While I may be alone at the top of the hill, I’m willing to die there alone (not actually if I am wrong I will apologize feverously). Hopefully, you are channeling your inner James Patterson and know to “Assume nothing, [and] question everything.” If you are channeling that ideology, you are likely challenging me internally (or in the comments) on my bearish mindset. Firstly, good on you. However, I plan to change your mind with The Charts & Numbers.
This is a long article so I wanted to give a quick summary of each section for those of you on the move. Per usual, you can use the links in the article to jump around to different sections:
Inflation Nation
Inflation (that ole CPI) is high, and higher than is being reported. High inflation incentivizes spending which causes problems down the road. PPI inflation numbers are very high too.
Consumer/Residential Real Estate Goes… Up?
The short answer is it depends: prices, yes; buyers, no. People’s paychecks are being eaten by growing monthly mortgage prices and inflated daily goods. They can’t keep up with housing prices.
Commercial Real Estate Crumbling
Companies have been extending their debt maturity dates and it has all surmounted in 2024. High interest rates with $6 trillion of commercial real estate debt are a financial risk for the economy.
The 85% Rosenburg Recession
A model used by Rosenburg research says a recession within the next 12 months is 85%. They had a similar prediction that lasted began in 2005 and came true in 2008.
Layoffs Not Laying So Low
Layoffs, especially at large companies, have been running rampant since 2022. While they are lower now, they are still at staggering levels.
No Worries - Consumers Still Spending
Consumer spending is up 1.9%, sounds good - it isn’t. Savings rates have also dropped under 5%.
Market Reliance: FAANG
Nearly a quarter of the stock market is made up of 5 stocks and way too many people are exposed to their price movements - directly and indirectly.
Nvidia and Its Sidekicks: Revenue Exposure
In accordance with the above, many of these companies also have high revenue exposure in a place they shouldn’t - hopefully, we attain world peace so these companies’ bottom lines stay safe.
Pinched Penny Placement
What are good options for your money? The paid subscribers will enjoy this.
The Charts & Numbers
Inflation Nation

I know this isn’t new news to anyone, but sometimes we need to be reminded that the inflation rate over the past 4 years has been staggeringly high - well, relative to the 2% the Federal Reserve tries to maintain. When you look at the chart above, it seems like we are currently reapproaching normalcy since 2% and 3% are quite close on the number line. I would like to remind you that the difference between 2 and 3 is 33%. For inflation rates to achieve what the Fed calls stabilized we need a 33% drop to occur, and when you look at it that way it doesn’t seem quite as likely.
What is interesting about high inflation is that it incentivizes people to spend money. When inflation rates are high, your dollars (hopefully the millions of them) lose immense value every day. When you know that your money is worth less tomorrow than it is today, doesn’t it make sense to just spend it now? Or, similarly, if things are going to get more expensive tomorrow, shouldn’t you buy it today? This mindset is what has driven the markets to all-time highs and has driven consumer spending up drastically in the past few years.
The problem with inflation is that it creates a paradoxical loop where inflation incentivizes spending and the increased money/spending in the economy drives prices up (high demand higher price). Higher prices in conjunction with higher demand tend to drive company profits higher, and higher profits lead to more investment in stocks. Then with stocks growing drastically, and prices increasing inflation continues to grow. PLEASE NOTE: This little demonstration is put together with ceteris paribus - I am assuming nothing else changes. That means the Fed doesn’t change rates, there are no external factors, etc.
Nonetheless, you can see where the issue starts to form here: eventually, the money runs out and everything starts to trend in the opposite direction, but in a much quicker fashion: market crash.
I began putting this newsletter together before the FED’s recent press conference/release and nearly everything that happened in that span of time validated what I had written above. My final tidbit on inflation should be the one that truly hits home and comes after the FED’s release. The reported inflation numbers are just that - reported. I implore you to stop looking at the numbers and to look at the price of the things you buy daily. Everything is rising so much in price it is nearly unreasonable and is outpacing the reported inflation. There are multiple articles and videos on this topic so I won’t bore you here. Sometimes, however, even the reported numbers look bad and we seem not to notice. The PPI (this is the producer price index: basically how much costs are rising for producers) doubled from what was predicted to be. It was expected to rise by .3% and instead rose by .6%, and that is just in one month. Annualized, that inflation value is over 7% - just a tad higher than the 3% reported for CPI, isn’t it? Yes, I know I just correlated CPI and PPI. While that seems like an “apples to oranges” comparison at first, in reality, consumers will feel that pain in the future. Those increased producer prices will be passed on directly to you, the consumer, so get ready.
Consumer/Residential Real Estate Goes… Up?
I recently wrote an article about the way we feel about Real Estate and you can find that here:

I promise to keep this section relatively short since you have some wonderful writing to look at in that article. However, I would like to mention there are a lot of good charts and numbers to look at for residential RE.

Firstly, new one-family home sales - a place where things are likely to stagnate/ decline. Rates - as stated by the Fed - are not expected to see a decline for the foreseeable future. That being said, if the FED decides to make an early rate cut during the summer, this could be flipped upside down completely. That rate cut is unlikely, however, and people aren’t going to be able to continue affording their $2,883 mortgage payments with high inflation numbers and wages not increasing enough to cover them. By the way, that $2,883 mortgage payment is average for a 30-year fixed rate mortgage according to Business Insider. People aren’t likely to keep paying high mortgages when high inflation numbers also loom.
Using a website called salaryaftertax.com we can find out that a 60k annual salary, in California, equates to a 48k take-home pay (also known as homeless in CA). This take-home pay is equivalent to about 4k a month. That means that if you own a home and are paying the average mortgage payment (which we all know Californians are not) you have a total of 1.1k a month to live on. This is where the problem now lies. Your average person has to cover the rest of their living expenses on one thousand dollars. How much of that do you think is going to get invested? How much debt do you think they will need to take on to keep their lifestyle? The answer is likely 0 for investing and lots for debt additions. The new question then becomes: How much longer can RE investors keep propping up the market?
Commercial Real Estate Crumbling

The answer to that last question above might depend on whether or not the hedge funds or investors have large exposure to commercial real estate (high defaults and 2008 here we come)! A Morningstar source stated,
Regulators in December said the near $6 trillion pile of outstanding commercial real-estate loans, of which about half were owned by banks, was a top threat to the financial system in 2024.
The Commercial RE debt has been on a constant steady incline since 2012 and as you’ll see in the following graph, we are seeing an incline in default rates too.
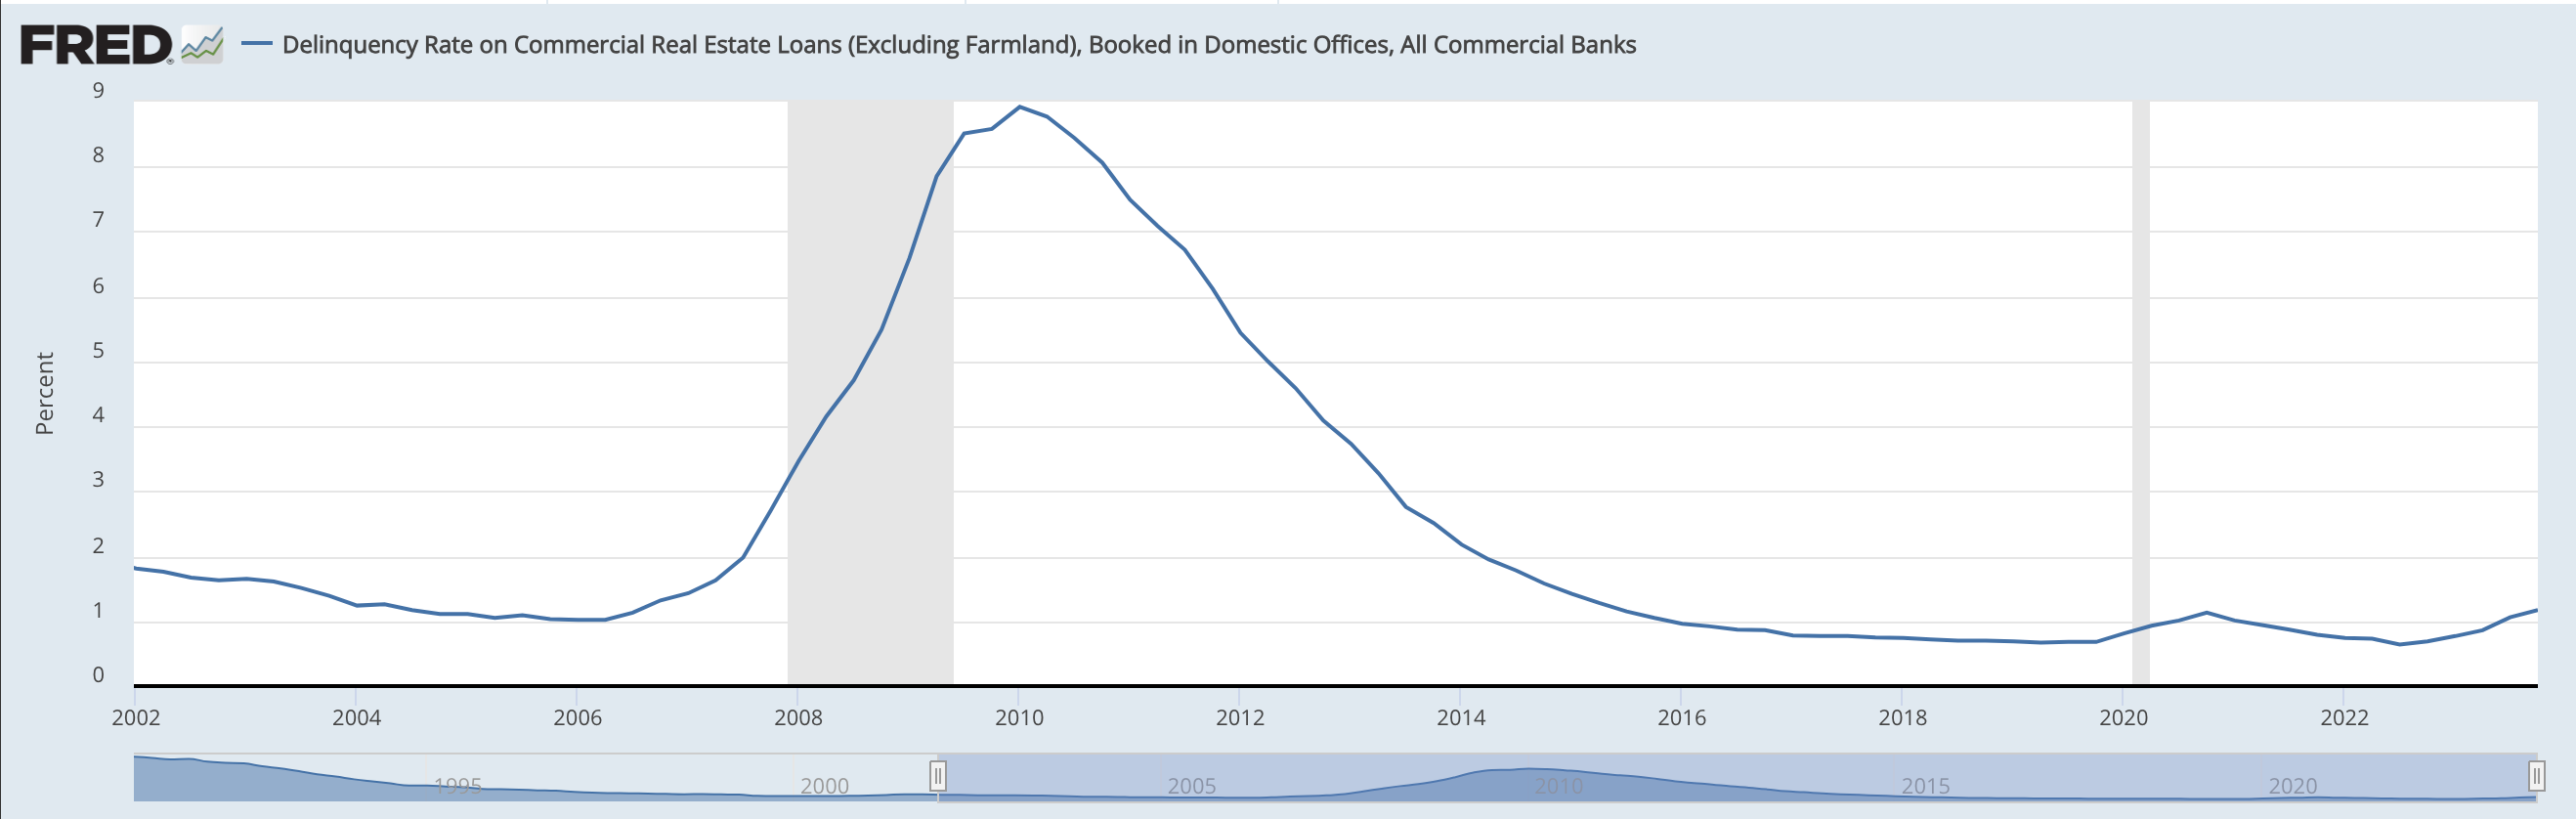
While things are nowhere near the levels they were in 2008-2010, you can see how quickly things can escalate in short periods. The other thing this graph doesn’t show you is the number of loans that have had their maturity dates pushed further out. This is happening more often than you think. Goldman strategists say,
[A] decent portion of the loans that were set to mature last year were modified and extended to 2024. Unsurprisingly, office loans have benefited disproportionately from modifications.
Those who are paying on commercial real estate loans have been betting for years that their extensions will be accepted, but with the current interest rate rise you have to wonder how much longer they will be willing to make their payments. Defaults are on the rise while maturity dates are similarly being pushed further back, and this spells trouble for everyone who was hoping to refinance on shrinking rates (that never occurred) too. Things aren’t looking good in the world of real estate - commercial or residential. I leave you, in this section, with one final set of numbers from a Business Insider article:
The costs have climbed as office property values have crashed. In February, Canada's largest pension fund sold a stake in a New York City building for a single dollar, an extreme example of the dire value proposition for many office buildings struggling with lower occupancy.
The 85% Rosenburg Recession

You’re reading that title and are seeing that graph correctly - there is an 85% chance of a recession occurring in the next 12 months. Well, that is according to what Rosenburg Research says. His model, found in the graph above, is based on this paper and utilizes things like debt-to-service coverage ratios and yield curves among other things. To make it simple: if a company has debt and its profits can’t cover it, there is a higher likelihood of default on said debt.
The scariest part of this graph is the stunning accuracy. In 2009 the likelihood of a recession dropped to 0%. It stayed there, even through COVID-19, and NOW it has launched itself to levels equal to that of the 2005-2008 levels. When the predictor jumped up in 2005 it took 3 years before the crash materialized - whether or not that will happen again is to be determined.
Layoffs Not Laying So Low

Arguably, they are higher than most people know. Business Insider stated that,
Nearly 40% of business leaders surveyed by ResumeBuilder think layoffs are likely at their companies this year, and about half say their companies will implement a hiring freeze.
Surely these high layoff likelihoods are coming from small, poor-performing companies, right? Depends on if you consider IBM, Google, Discord, Citigroup, Amazon, Twitch, Nike, and BlackRock to be the typical underperformers. Companies are starting to realize that they don’t have the capital to maintain their workforce and this is going to start hitting the economy soon. What’s even more terrifying is that these layoffs aren’t anything new. They have been happening at high levels since 2022. People leaving the workforce or rejoining after layoffs means lower salaries and less money to spend. Less money to spend leads to less demand and less demand leads to a shrinking economy.
No Worries - Consumers Still Spending
While I would love to join everyone in singing Hakuna Matata about the market’s growth over the past year (up over 30%), I can’t help but be weary. Consumer spending was up over 1.9% in the 4th quarter of 2023, but I would hold the applause. There are a few reasons why consumer spending is up and none are good. The most obvious reason: inflation. Prices are higher, so of course people are spending more (there is no other option). When buying food and paying your electric bill goes from $500 to $509 you have to spend that extra $9 (aka a 1.9% increase in spending).
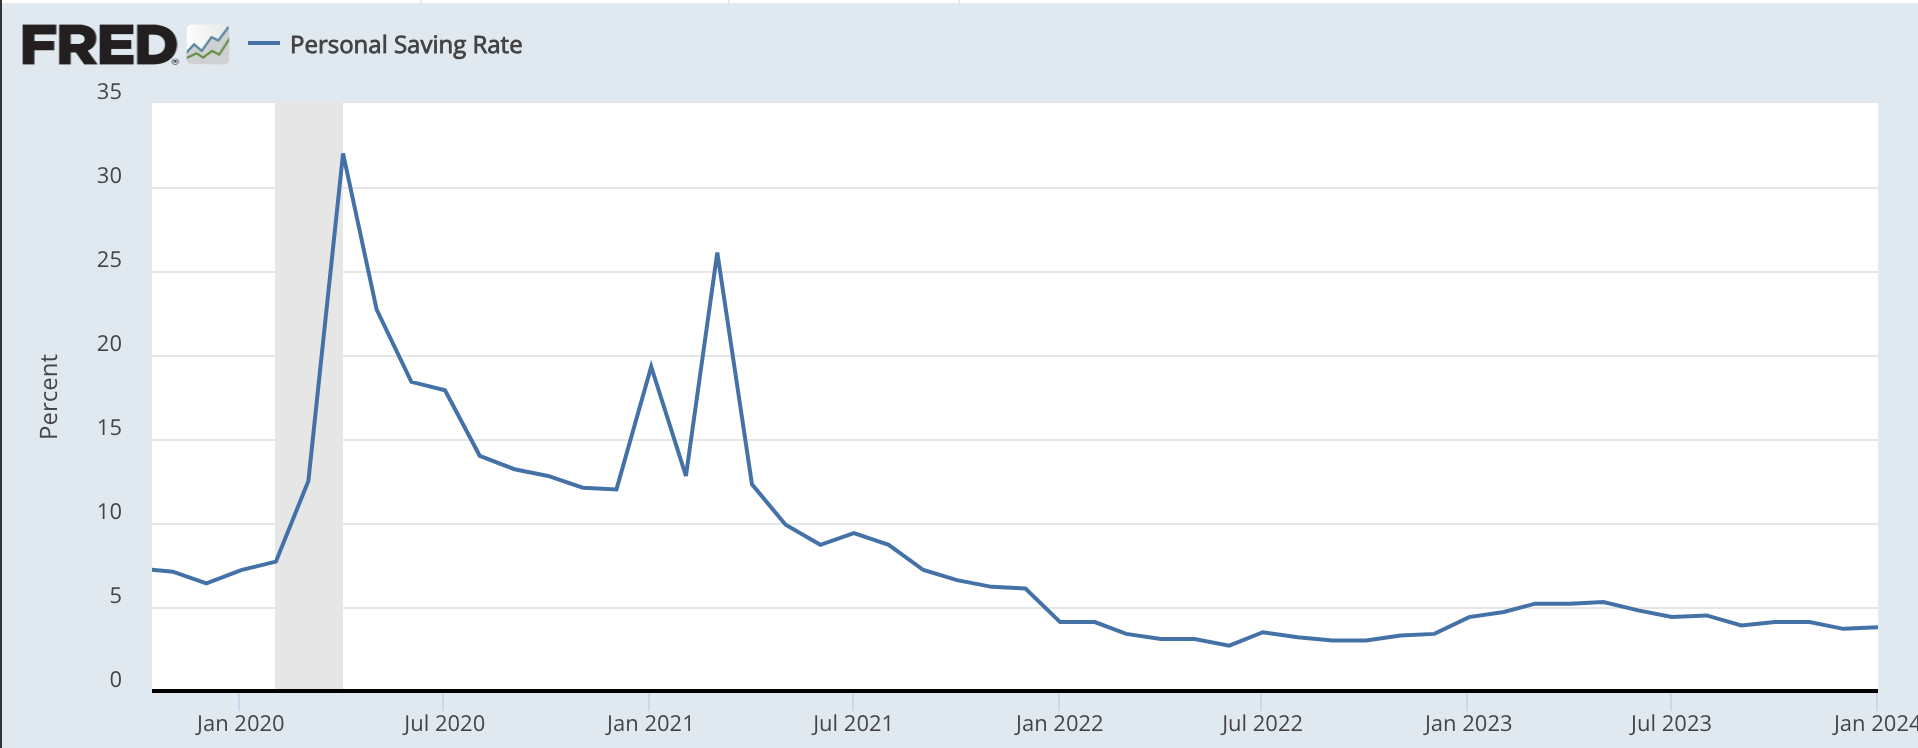
People are not spending more because they have more, people are spending more because they have to. Speaking of spending more because they have to, net saving rates have been trending down since the stimulus checks of 2020. In fact, saving rates are under 5%. (Is it time we all apologize to Dave Ramsey for not saving 20%?)
Market Reliance: FAANG
Currently, the top 5 S&P companies make up 24.3% of the index. This presents an interesting conundrum for investors. Nearly everyone who has money in S&P tracking ETFs or has directly invested in FAANG stocks is exposed heavily to downturns with these stocks.
The FAANG stocks being META 0.00%↑, AAPL 0.00%↑, AMZN 0.00%↑, GOOG 0.00%↑, and NVDA 0.00%↑ or NFLX 0.00%↑
So, where do the issues lie? Well, if these stocks begin to trend negatively, say some governmental regulation causes issues (something that isn’t unheard of), it will have a larger-than-normal impact on the S&P and related ETFs. In turn, this could prompt those ETF investors to sell, taking more money out of those 5 stocks (along with others in the ETF). Now, decreasing ETF prices and further decreasing FAANG stock prices would prompt more profit-taking/selling. Of course, you could say that this would prompt more buying, but I would challenge one to state what/who has the money available to do so. Without the available capital to buy back in and stabilize prices, one of those great stock spirals occurs.
Hopefully, however, you remember the Patterson quote from earlier, “Assume nothing, [and] question everything.” If there is one thing that the stock spiral I discussed requires, it’s a lot of assumptions. There will likely have to be negative externalities, changing laws, another COVID, etc, occurring to prompt the bearish market. Oh right, there is one other externality that doesn’t seem so unlikely that would affect all of the above, and it has to do with a little country we call “The Breakaway Providence.”
Nvidia and Its Sidekicks: Revenue Exposure
Oh sorry, that isn’t what most people call Taiwan, that is what China calls Taiwan. Why am I talking about Taiwan? Great question! I’ll get into it in 2 seconds, but you need some background first. The following picture is from Nvidia’s blog and shows how much of the market relies on their products.

Staggering. So now, ask Nvidia and the hundreds or thousands of companies that rely on their chips and tech for their operations why Taiwan matters. While you’re at it, ask those mega-cap tech companies too. Okay, okay… since you can’t ask Nvidia, those thousands of companies, or the biggest companies in the market why Taiwan and China matter, I’ll tell you: revenue exposure.
How much exposure? Well, 20% of revenue on average for those mega-cap stocks. Most of which rely heavily on Taiwanese manufacturer Foxconn. Nvidia is nearly 100% reliant on one company, Taiwan Semiconductor Manufacturing Co.(TSM 0.00%↑), but don’t worry the CEO says it isn’t a problem, Reuters reports:
"When I was here, in all of our supply chain discussions, we feel perfectly safe," Huang told reporters on the sidelines of a technology event in Taipei, when asked about the political risk of the world relying so much on Taiwan for chips given the China tensions.
In case you haven’t noticed, China’s economy is hurting, and bad. Taking over some of the largest chip manufacturers in their “Breakaway Providence” sounds like a sweet deal for them right about now. Remember that negative externality that could cause a market spiral? Starting to seem more and more plausible, isn’t it?
Pinched Penny Placement
My time has come to give those paid subscribers some MAJOR VALUE for the dollars they toss my way. You’re gonna miss out on this if you subscribe for free, but I hope you enjoyed your read. If you did hit that button below and send this article to that friend of yours who won’t shut up about how great FAANG and Nvidia are.
While there are multiple ways to negate all of the issues above, I will hit them all at a high level and as always remind you to make the best decision according to your own view.
Keep reading with a 7-day free trial
Subscribe to The Simple Side to keep reading this post and get 7 days of free access to the full post archives.