No Investment Advice or Brokerage; Disclaimer. For the avoidance of doubt, The Simple Side does not provide investment, tax, or legal advice. The value of any asset class can go up or down and there can be a substantial risk that you lose money buying, selling, holding, or investing in any asset. You should carefully consider whether trading or holding assets is suitable for you in light of your financial condition.
If this is your first time here, welcome! If you’re one of the nearly 300,000 returning subscribers, welcome back — we are glad to have you all!
Before we get into today’s newsletter, I want to hear from you… yes you! Every newsletter I send has a quick survey you can use to request changes to the newsletter. Fill it out!
Nothing major to cover here — I have made minor adjustments to the newsletter based on previous requests!
Newsletter Content Today
FREE CONTENT
Updates & Developments
Portfolio Returns & Updates **NEW**
Market Trends & Outlook **NEW UPDATES**
Weekly Politician Trading Report
Weekly Insider Trading Report **NEW UPDATES**
Gold Report
Weekly Article Summary
PAID ACCESS ONLY — Thank you for all your support!
Stock Buy Summary
Mergers & Acquisitions Stocks
Top Stock Investment Ideas
Micro Cap Stock Picks
Earnings & Options
Updates & Developments
Current Developments
Copy Trading (More emails on the way!)
I have sent two emails to paying subscribers about their ability to copy trade with me on DoubleFinance. If you haven’t received an email from me, but want to — reach out to me @ thesimplesidenews@gmail.com.
Stock/ ETF Scanner
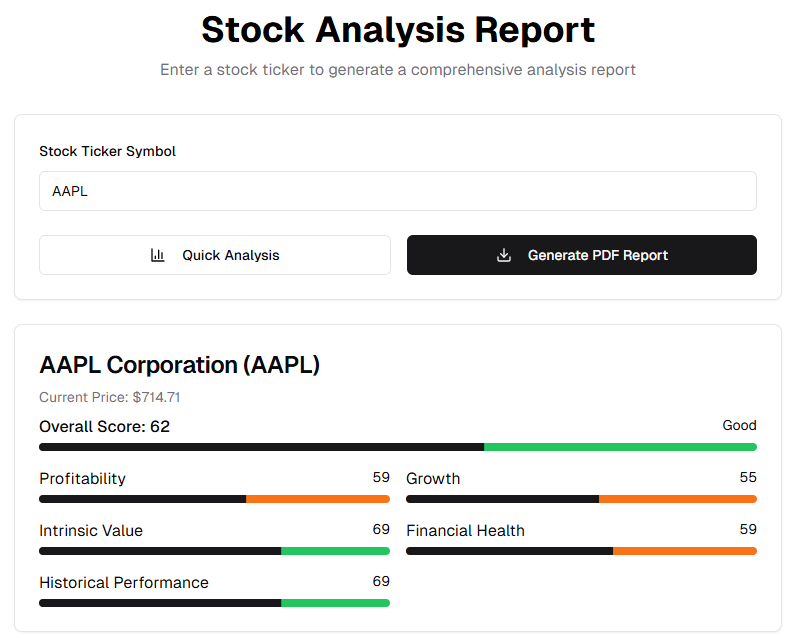
We are only weeks away from our massive release of our stock scanner tool and fully integrated insider, politician, and guru tracking website! Soon you’ll be able to generate stock analyses at the click of a button!
Paying subscribers to the newsletter will be getting a year of free access to this tool and our entire website!
Updates
Soon we will be starting the next paid subscriber raffle where we plan to giveaway over $2,000 in stock! Make sure you are entered to win by joining paid now!
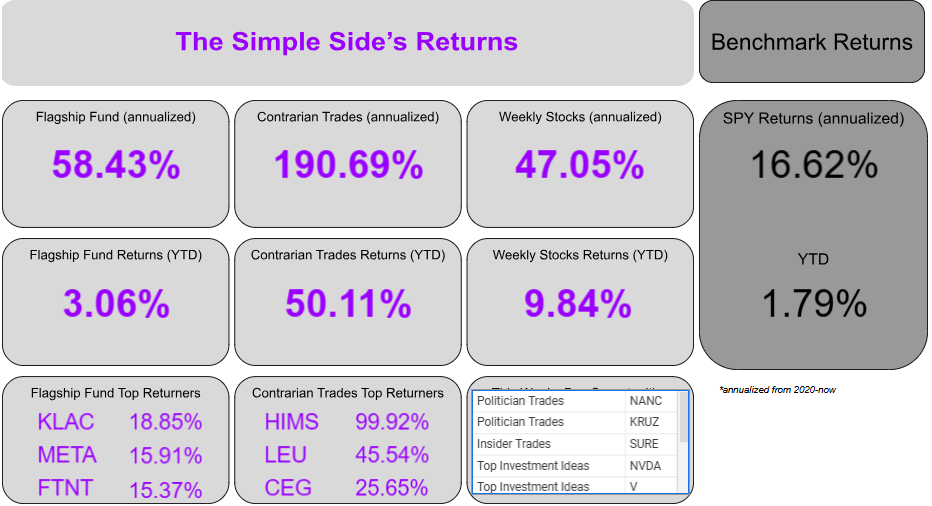
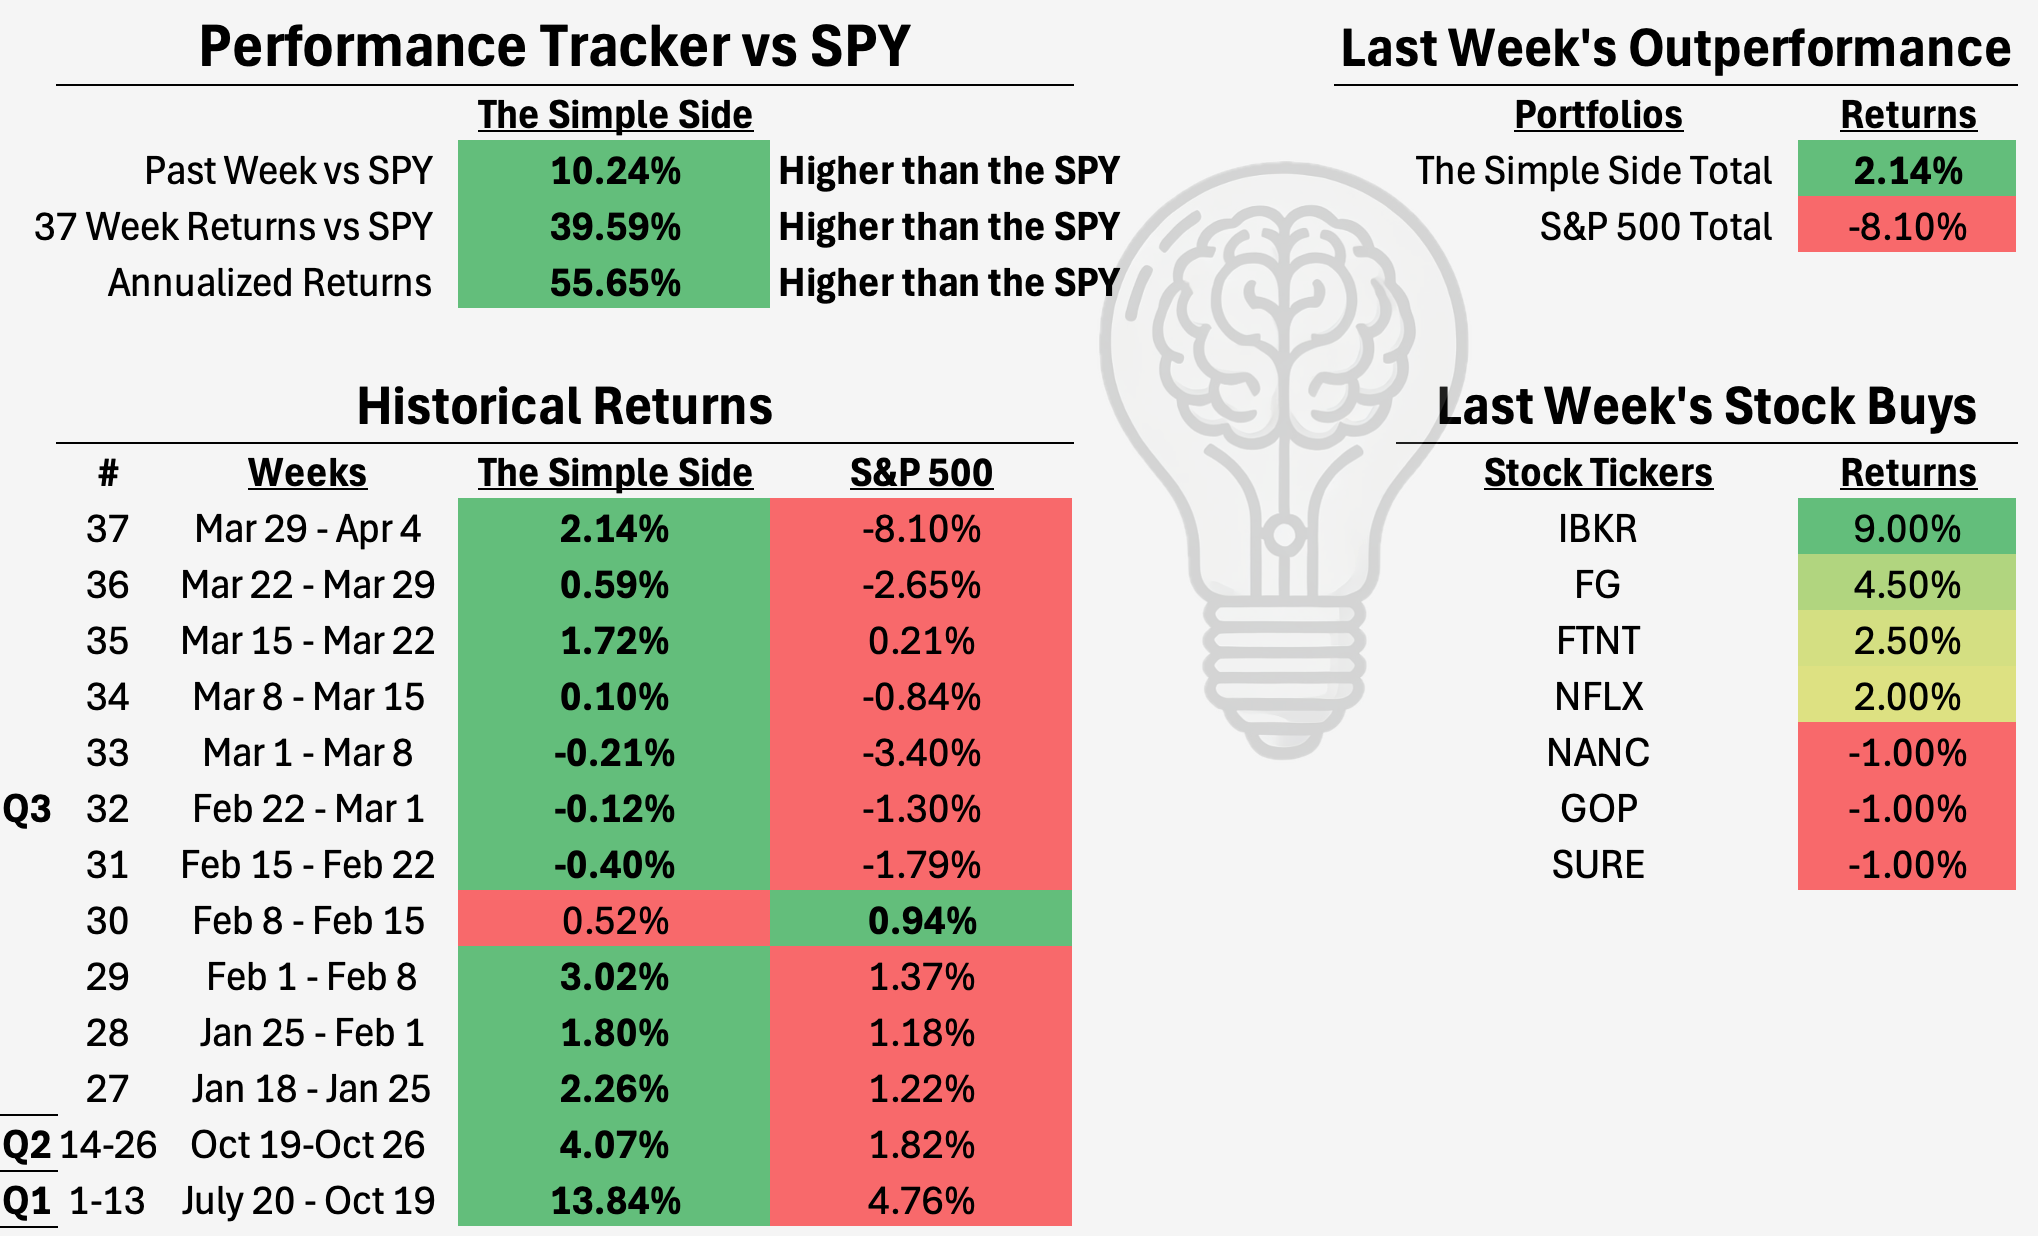
When the market is down and the average return of my portfolio remains at 12%, I will complain about nothing. Last week, and a few weeks before that, I mentioned that our weekly trades would be the outperforming portfolio. That has proven to be true.
Markets that are declining are always traders markets. Passive investing will never win in a declining market. I understand this. My subscribers understand this. Collectively, we have been able to outperform based on this reasoning, and this will continue to be the case.
I will be DCA-ing (investing monthly) heavily into my portfolios as things continue to fall. There are a couple of companies that I would love to add as valuations fall. A few tickers that I am looking at are FG and ACGL.
Of course, I have been preaching ZROZ as a hedge to all of the madness in the world… ZROZ +7.21 YTD.
Weekly Trades Performance Weekly Picks Available After Paywall For Premium Subscribers
The graph shows the growth of a $10K investment which began on July 20, 2024. You can find every newsletter dating back to July 20th here by CLICKING HERE.
Here are the current performance metrics:
If you haven’t joined already, you can click the button below to join the paid newsletter and get these weekly picks sent to your inbox every Saturday!
Currently, the projected YTD market returns are now 2.4% — a major increase from last week’s 0.8%. This week in the markets, we saw a violence only seen in Chuck Norris movies…
- 1672 stocks with gains - 8043stocks with losses - The median return was -7.98%
This is the worst return ratio we have seen in the markets since I started this newsletter, and I have been saying for weeks now that the markets were going to continue down! Again, here is a direct quote from last weeks newsletter:
The bad news is that there still seems to be no turning around from the current negative directional shift. We will likely see next week open lower.
What changed? Tariffs… again.
That is exactly what I said last week. Word for word. I even put together a covered calls article two weeks ago for everyone so you could protect your portfolio! I want you to be smart and safe during the downturn!
I hate to repeat myself every week, but when the market does the same thing week after week (go down down down, like the ring of fire - Johnny Cash), I have to keep saying the same thing.
We are not consumers, WE ARE INVESTORS. We need to be watching data and staying away from the news. Pay attention to earnings reports. Pay attention to the revised data metrics coming from the Fed as well.
Pay special attention to inflation numbers, low inflation could mean dropping rates and even better bond prices for current investors.
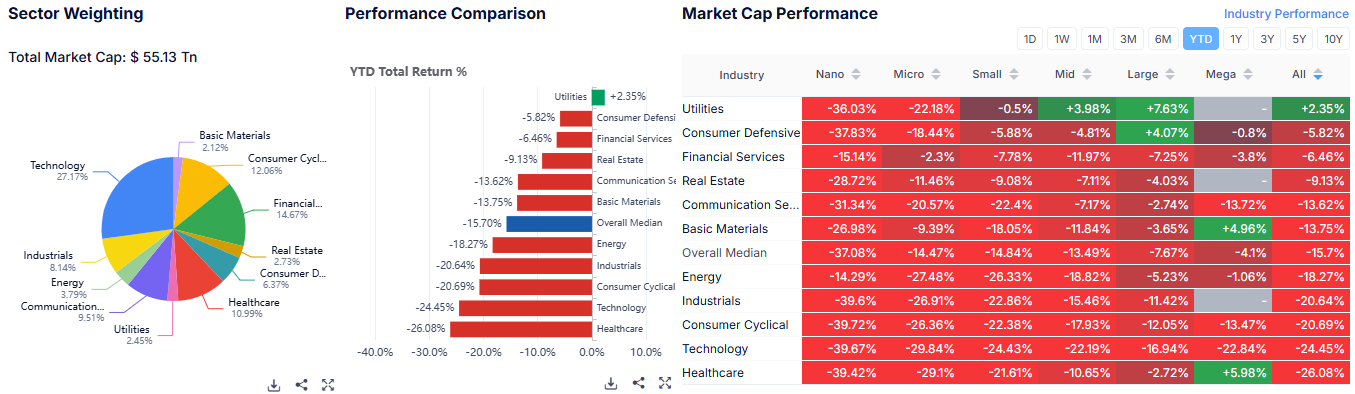
Sector Analysis
Typically, I would cover the top and bottom performing sectors of the week… nothing was green this week. Every sector was negative. Here are the worst performers:
Mohnish Pabrai (the “Warren Buffett” of India) believes that investing in what is “Hated and unloved” is the best road to success.
Typically, this report shows us this quote in action, even on the week-to-week basis! Often times we will see sectors in the top three performers flip to a bottom 3 performer and vice versa.
If you’re looking for sectors that investors currently hate, look at the following sectors, which have underperformed the market YTD and over the past month:
Energy— down 18.27% YTD Industrials — down 20.64% YTD Consumer Cyclical — down 20.69% YTD Technology — down 24.45% YTD Healthcare — down 26.08% YTD
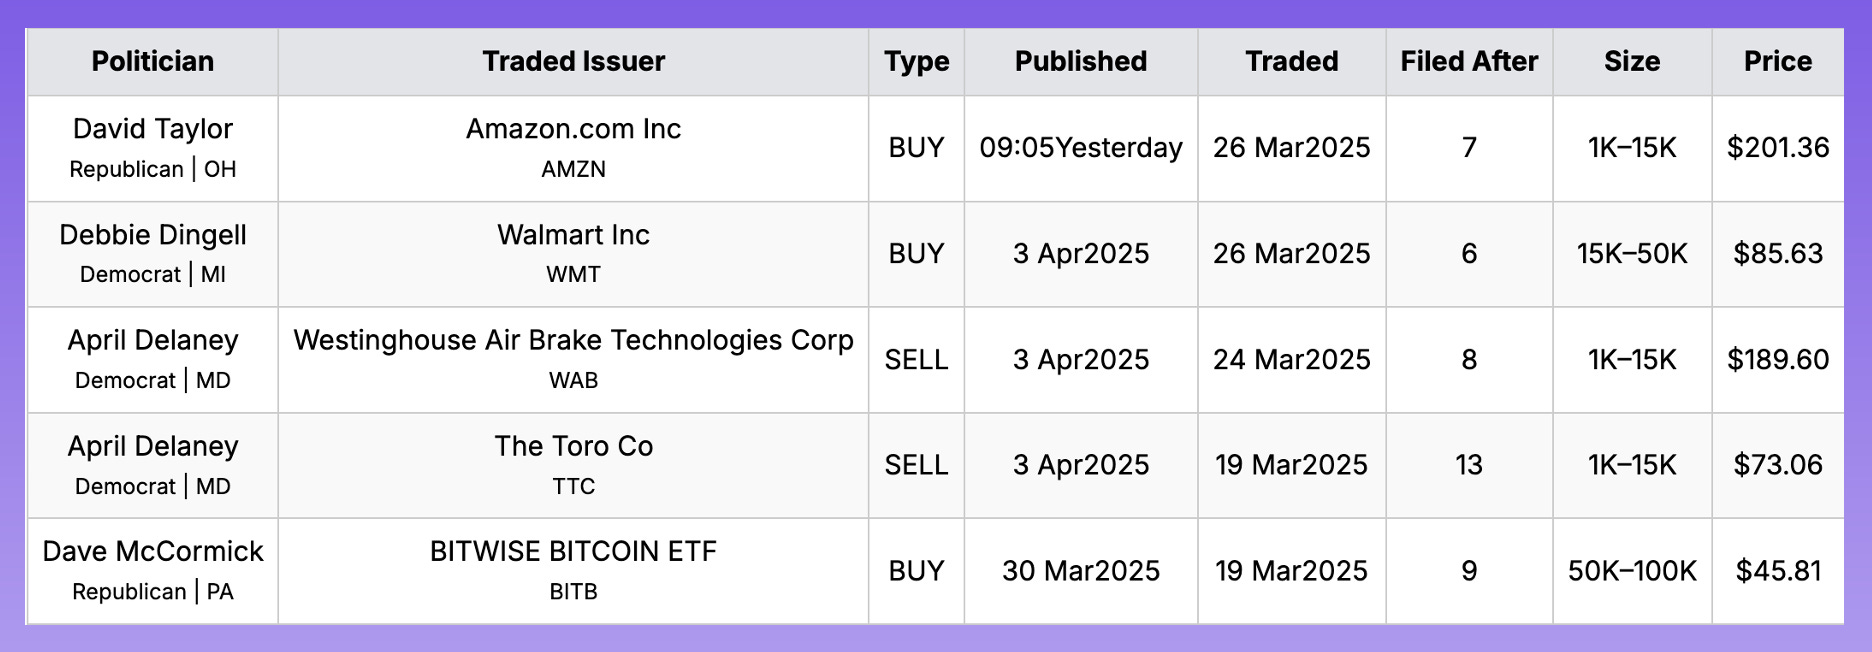
Politician Trading Report
Politician trading matters… a lot. In 2024, the top-gaining politician was republican David Rouser, who returned 104.1%, followed closely by democrat Pelosi who, returned 70.9% over the year.
This report tracks the five most recent politician trades and two large holdings in my portfolio — ETFs NANC 0.00%↑ (which tracks democrat trading) and GOP 0.00%↑ (which tracks republican trading).
NANC was -7.52% on the week, -13.29% this past month, and -15.13% YTD. GOP was -8.12% on the week, -9.43% this past month, and -11.02% YTD. **The name of this ETF has changed! For comparison, the SPY year-to-date is -13.57%.
Over the past 30 days, 10 politicians made 48 trades with a total trade volume of $1.37 million. The buy/sell ratio is still 3.33, the same as last week. This shows continued bullish sentiment, which does come as a surprise.
Here are the 5 most recent politician trades:
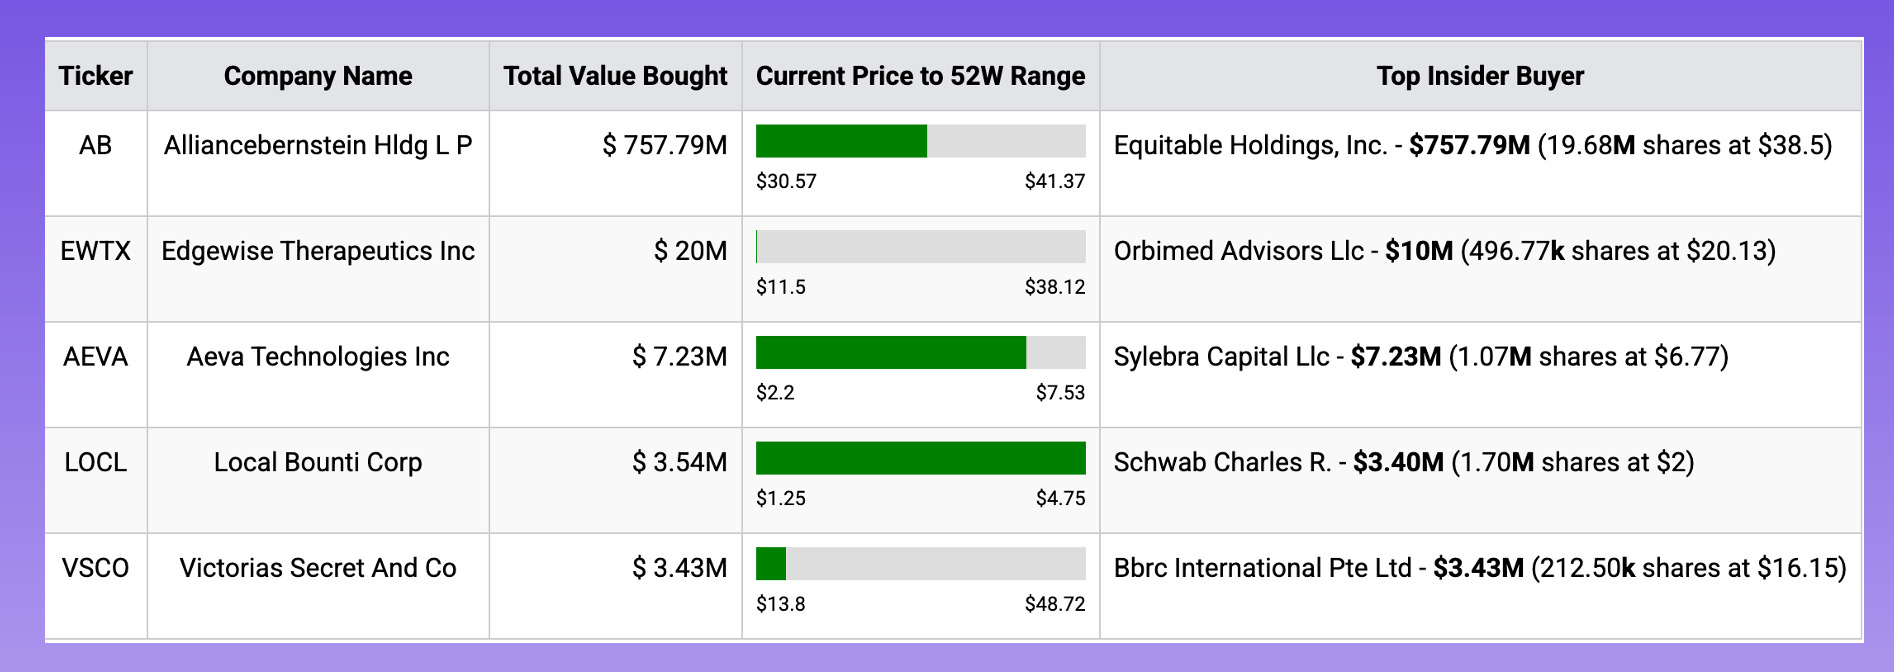
Insider Trading Report
This report tracks the five largest insider buys from the past week and a new ETF in my portfolio — ticker SURE — which tracks insider trading.
SURE is -8.49% this week, -11.53% this month, and -12.99% YTD.
The monthly buy/sell ratio is up to 0.38 — higher than last week’s 0.34 — and above the 5-year average of 0.35. This indicates a slightly bullish sentiment from insiders.
Here are the 5 largest trades from this past week:
Here are two interesting transactions from the report above.
Equitable Holdings
Average Return per transaction: +15.39%
Outperforming Transactions: 100% on 4 trades
Stock Bought
AllianceBernstein Holding LP (AB) - 100% of current portfolio - 3 buys & 0 sells over 5 years
Equitable Holding’s purchase of $700M worth of AB stock comes as a complete surprise as they bought right in the face of market downturn. What do they know that we don’t? Why not wait until the markets bring the stock further down before investing? That’s something that I don’t have an answer to. 🟢The stock is a buy for this next week!🟢
The company is trading at a forward PE Ratio of <10 and has an 11% margin of safety based on the DCF I ran.
Sylebra Capital Ltd
Average Return per transaction : 132.08%
Outperforming Transactions: 95% on 20 trades
Stock Bought
AEVA History - 15.31% of current portfolio - 1 buy & 0 sells
AEVA is down 10.06% over the past week, but is up over 153% monthly. This is the second week that Sylebra Capital has poured money into the stock, however, I still can’t put it on my buy list for the week. Overall, the company doesn’t look great, they are burning through cash, have no profits, and have been issuing more stock.
I will be ignoring this purchase.
Our premium subscribers get access to long-term, mid-term, and short-term strategies that all beat the market. You can too, join now!
Technical Gold is showing signs of weakness as its price accelerates its decline, flirting with the critical $3,000 psychological mark. Currently, the pair trades around the $3,100 level, but the recent pullback is notable. On the upside, the $3,115–3,125 congestion zone is acting as an immediate hurdle, followed by resistance near $3,143 and the all‐time peak around $3,157–3,158. On the downside, technical support is expected to firm up near the intermediate level of $3,036–3,035—if the decline gains momentum past this point, further selling could drive the price closer to $3,000.
Fundamental The recent downward pressure on Gold is largely driven by a rebound in the US Dollar and tightening US yields, both of which are gaining traction as traders digest President Trump’s new tariff measures.
With investors increasingly cautious amid concerns that sweeping reciprocal tariffs could hamper global economic growth and potentially trigger a US recession, market participants are reluctant to add new bullish positions. The wait-and-see approach, particularly ahead of the upcoming US Nonfarm Payrolls (NFP) report, has further contributed to the negative bias observed over the past two days.
Scenarios & Strategy In the near term, if Gold fails to defend the intermediate support zone around $3,036–3,035, technical selling could intensify, pushing the price closer to the $3,000 mark. Conversely, if buyers manage to step in and halt the decline, a bounce might occur, potentially propelling Gold back toward the congestion zone near $3,115–3,125 and beyond.
For traders, it may be prudent to wait for clear follow-through selling before considering short positions, while long-term investors could view a sustained dip below $3,000 as an attractive entry point—provided the broader safe-haven fundamentals eventually reassert themselves.
Prior Week Callout Last weekend, our outlook painted a picture of Gold remaining resilient amid ongoing tariff concerns and safe-haven demand, expecting the uptrend to hold despite intermittent profit taking.
Today’s data, however, reveal that the US Dollar’s rebound and the tightening of US yields have accelerated Gold’s decline, catching the metal on the back foot. While we anticipated some volatility, the strength of the sell-off—reflected in the approach toward the $3,000 level—suggests that market sentiment has shifted more swiftly than forecast.
This divergence underscores the importance of monitoring both technical pivot points and evolving fundamental factors, particularly in a volatile environment influenced by geopolitical and policy-driven headwinds.
The Weekly Summary
This week we took a pause on the mid-week article. I wanted to watch the markets play out before sending out any new/updated Berkshire buys or educational articles. I also have been HAMMERING the new website that we are planning to roll out to subscribers this month. I am putting in tons of overtime trying to make sure everything is up to par with what I want to offer my audience.
I have a couple of Berkshire buys on the way, and some great ideas for some educational articles as well. All that being said, there are a few things that I want to cover in the coming weeks as well.
I would like to start the development of a monthly “top ideas” newsletter as well. It wouldn’t be too terrible in depth, but it would cover all of the areas I am looking at investing in/ ideas I have had over the month. I think it could be extremely beneficial for those of you who subscribe to me in search of making your own investing decisions, but want to make use of the knowledge I share.
Let me know in the survey if you would like to see this!
Paying subscribers, all of your info and analysis are below! Enjoy, and I will see you all next weekend. Look for educational emails and copy trading announcements coming in this week.
If you want access to it all, join before prices soar (just like your account will with The Simple Side). JOIN HERE or click the buttons below.
This is where I bring you a curated list of stocks my model says offer the best upside with the least potential for loss this week. Of course, I will report on all of the stocks weekly, but that doesn’t mean you need to buy all of them or any of them every week. Do your own diligence, and you might just outperform me!
Quick PSA: We treat the trades as buys on Monday’s Market open and sells on Friday’s Market close. You pay for my research, my time, and most of all the saving of your time. That’s why we have a summary of everything below right here:
🟢 The Buys:
Listen to this episode with a 7-day free trial
Subscribe to The Simple Side to listen to this post and get 7 days of free access to the full post archives.
The Saturday Sendout is tradeable market news in one place. Get weekly financial information on insider, company executive, and politician trading plus tons of other insights.
The Saturday Sendout is tradeable market news in one place. Get weekly financial information on insider, company executive, and politician trading plus tons of other insights.