No Investment Advice or Brokerage; Disclaimer. For the avoidance of doubt, The Simple Side does not provide investment, tax, or legal advice. The value of any asset class can go up or down and there can be a substantial risk that you lose money buying, selling, holding, or investing in any asset. You should carefully consider whether trading or holding assets is suitable for you in light of your financial condition.
If this is your first time here, welcome! If you’re one of the nearly 300,000 returning subscribers, welcome back — we are glad to have you all!
Before we get into today’s newsletter, I want to hear from you… yes you! Every newsletter I send has a quick survey you can use to request changes to the newsletter. Fill it out!
To get access to all of my long-term portfolios, weekly picks, and market deep dives, head over to this link and subscribe today — or click the link below!
I have sent three emails to paying subscribers about their ability to copy trade with me on DoubleFinance. If you haven’t received an email from me, and you are a paying subscriber — reach out to me @ thesimplesidenews@gmail.com. I get a lot of emails so you might have to email a few times for me to catch it!
Updates
Our next paid subscriber raffle will be starting soon!! Last year we gave away over $4,000 in total to subscribers. Here’s one of the comments from one of last years winners:
You likely noticed I didn’t post twice this week. Typically, as a subscriber, you receive a free weekly stock analysis and a free educational article. Hopefully, you didn’t miss me too much.
I have been missing in action because of the extra behind-the-scenes work I have been putting in on both the upcoming website and some new contrarian trades.
I hope to “pre-release” the website to paying subscribers this month, and I will also send out the additional/new contrarian trades this week!
I am extremely happy with what content we will release in the coming weeks and am sure this will provide exponential value to Simple Side shareholders (aka paying subscribers).
**Weekly Picks Available After Paywall For Premium Subscribers**
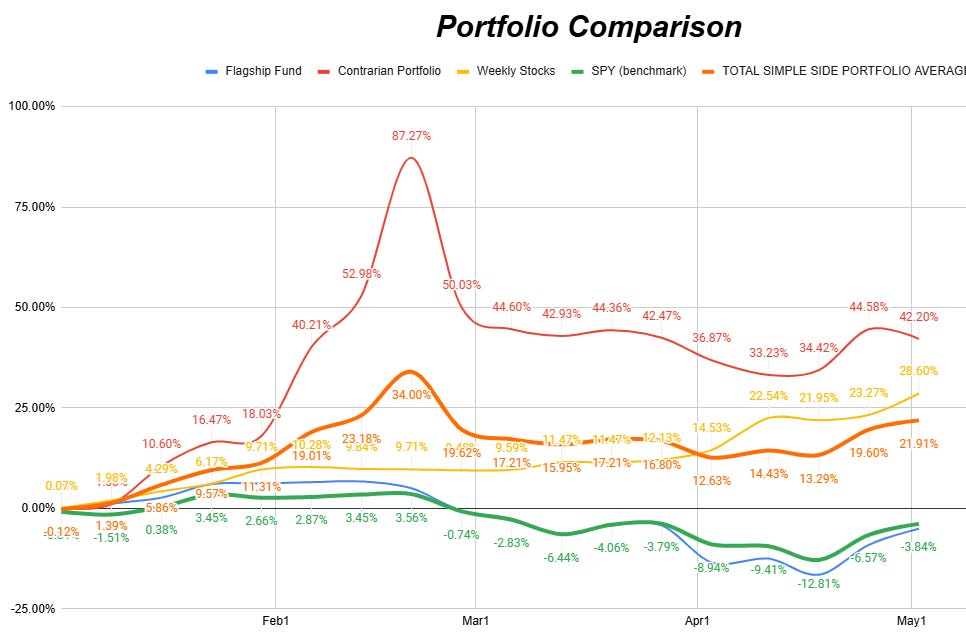
The graph shows the growth of a $10K investment which began on July 20, 2024. You can find every newsletter dating back to July 20th here by CLICKING HERE.
Here are the current performance metrics:
If you haven’t joined already, you can click the button below to join the paid newsletter and get these weekly picks sent to your inbox every Saturday!
Currently, the projected 1-year market returns are 1% — lower than last week’s expected 1.4% returns.
This week we saw:
- 6197 stocks with gains - 3170 stocks with losses - The median return was +1.93%
Here is the distribution of returns:
Commentary
Last week, I gave some insight into the wild ride known as “The US Stock Market.” We have been on a rollercoaster, hitting some of the highest highs and lowest lows — making history in the market! Most recently, we saw the longest S&P 500 winning streak in 20 years. Nine (9) straight days of gains!
Through all of the mess and noise, I mentioned that I had been seeing some interesting action in the energy sector. I mentioned Berkshire’s purchase of OXY and Dailo’s purchase of VST. Both stocks had respectable weeks, up 1.21% and 7.99% respectively.
As mentioned before, I have been holding all my stocks, adding PM and WM as volatility hedges, and buying each market retracement over the past few months.
The market and investors are all sitting on the edges of their seats at the moment. Looking for nearly any reason to go all-in or cash out of their holdings. This has led to some of the most ridiculous fabricated news stories breaking and being traded over the past couple of days.
There have been multiple headlines that have come out and they have affected markets tremendously. Remember when I sent that article talking about dumb money? We are seeing the effects in real time right now.
These companies make the most amount of their money when they get you all worked up about something. It is their job to insight fear or greed into the minds of their readers and viewers. I make money when my stock picks do well, not when I make up a BS news story about the stock market.
Sector Analysis
Top 3 Weekly Performers
- Industrials: +3.34% - Real Estate: +2.81% *Bottom performer last week - Technology: +2.47%
Mohnish Pabrai (the “Warren Buffett” of India) believes that investing in what is “Hated and unloved” is the best road to success.
If you’re looking for sectors that investors currently hate, look at the following sectors, which have underperformed the market YTD and over the past month:
Consumer Cyclical — down 16.24% YTD Industrials — down 11.68% YTD Energy— down 11.74% YTD
Politician Trading Report
Politician trading matters… a lot. In 2024, the top-gaining politician was republican David Rouser, who returned 104.1%, followed closely by democrat Pelosi who returned 70.9% over the year.
This report tracks the five most recent politician trades and two large holdings in my portfolio — ETFs NANC 0.00%↑ (which tracks democrat trading) and GOP 0.00%↑ (which tracks republican trading).
NANC was +3.69% on the week, +6.67% this past month, and -2.81% YTD. GOP was +3.36% on the week, +6.00% this past month, and -1.90% YTD. For comparison, the SPY year-to-date is -3.83%.
Over the past 30 days, 10 politicians made 125 trades with a total trade volume of $1.96 million. The buy/sell ratio is down drastically to 0.77, much lower than last week’s value of 2.57. This shows a slowdown of the politician's bullish sentiment. Interesting how, for the past few weeks, we saw politicians buying at never-before-seen levels, then they stop after the historic 9-week run the S&P 500 had. Seems the folks on The Hill are the perfect people to watch when the markets take a turn.
Here are the 5 most recent politician trades:
Insider Trading Report
This report tracks the five largest insider buys from the past week and a new ETF in my portfolio — ticker SURE — which tracks insider trading.
SURE is +3.56% this week, -0.37% this month, and -4.93% YTD.
The monthly buy/sell ratio is up to 0.60 — higher than last week’s 0.49 — and above the 5-year average of 0.36. This indicates a slightly bullish sentiment from insiders.
Here are the 5 largest trades from this past week:
Here are two interesting transactions from the report above.
Stefano Pessina
RETURNS
Average 1-month return: 1.59%
Outperforming transactions: 4/5 (80%)
Average 3-month return: 3.69%
Outperforming trades: 4/5 (80%)
Average 1-year return: 9.1%
Outperforming trades: 2/5 (40%)
STOCK / PORTFOLIO
Walgreens (WBA) - 100% of current portfolio
COMMENTARY
Stefano Pessina is Walgreens Executive Chairman of Board, and you might be thinking that with WBA down 75% over the past 3 years, copying the CEOs trades might be a great idea… well, I have something that might change your minds. Sure, Pessina bought over $9M worth of stock, but guess what else he did… sold it immediately. Stay away from WBA… not even the CEO believes in the companies ability to perform.
GMT Capital Corp.
RETURNS
Average 1-month return: -2.12%
Outperforming transactions: 26/68 (38%)
Average 3-month return: -1.33%
Outperforming trades: 34/68 (50%)
Average 1-year return: -3.27%
Outperforming trades: 31/68 (46%)
STOCK / PORTFOLIO
CBRL - < 1% of current portfolio
COMMENTARY
This is another showcase of why purchasing stocks based on insiders isn’t always the best move in the market. Some, if not most, insider buys actually underperform overall.
Our premium subscribers get access to long-term, mid-term, and short-term strategies that all beat the market. You can too, join now!
Prior Week Callout Last weekend we flagged that any dip into the $3,300–$3,260 zone would likely attract buyers, with the 21-day SMA around $3,234 serving as a critical line in the sand.
This week’s slip toward $3,234—followed by a swift rebound—validated that view: buyers defended the 21-day SMA once again, reinforcing the idea that near-term downside remains contained.
Technical Gold reversed its late-week rebound and slid toward the $3,260 area as US yields and a slightly stronger Dollar weighed on the metal. The 21-day SMA at $3,234 has so far capped losses, while a failure to hold that level would expose the $3,150 psychological mark and the 50-day SMA near $3,087.
On the upside, immediate resistance at $3,260 must be reclaimed to arrest the correction. Beyond that, former rising-channel support—now near $3,350–$3,405—looms as a tougher barrier before Gold can resume its longer-term uptrend.
Fundamental Optimism over a possible US-China trade breakthrough briefly lifted risk appetite and trimmed safe-haven demand for Gold. Bloomberg reports of tariff-exemption talks and upbeat comments from Treasury Secretary Bessent fueled that sentiment, even as China’s Commerce Ministry countered with measured language.
With traders now awaiting the US Nonfarm Payrolls report for fresh cues on Fed policy, the market is torn between fading trade fears (a headwind for Gold) and lingering recession-and-rate-cut bets (a tailwind).
Scenarios & Strategy
Bullish Rebound: If the 21-day SMA at $3,234 holds, and trade-deal hopes prove overblown, Gold could recover through $3,260 and challenge $3,300. A sustained move above $3,260 would open the former channel resistance at $3,350–$3,405.
Sideways Chop: In the absence of clear drivers, expect Gold to oscillate between $3,234 and $3,260 as markets wait on NFP and trade headlines.
Deeper Pullback: A decisive break below $3,234 would shift the bias to the downside, targeting $3,150 and then the 50-day SMA around $3,087.
Trading Plan for Next Week
Long Entry: Look to buy dips into $3,260–$3,234, where technical support has proven reliable.
Stop-Loss: Place stops just below $3,234 (e.g. $3,225) to guard against a deeper unwind.
Take-Profit:
TP1: $3,300 (round-number resistance)
TP2: $3,350 (former channel support turned resistance)
TP3: $3,405 (upper channel boundary)
Breakout Alternative
Should Gold close above $3,260, consider fresh longs with a stop at $3,234. In that scenario, target $3,300 and $3,350 for partial profits, leaving the remainder to run toward $3,405.
Risk per trade should be limited to 1–2% of account equity. Monitor both the US jobs data and any surprising developments in US-China trade talks, as either can rapidly shift Gold’s trajectory.
Paying subscribers, all of your info and analysis are below! Enjoy, and I will see you all next weekend. Look for educational emails and copy trading announcements coming in this week.
If you want access to it all, join before prices soar (just like your account will with The Simple Side). JOIN HERE or click the buttons below.
This is where I bring you a curated list of stocks my model says offer the best upside with the least potential for loss this week. Of course, I will report on all of the stocks weekly, but that doesn’t mean you need to buy all of them or any of them every week. Do your own diligence, and you might just outperform me!
Quick PSA: We treat the trades as buys on Monday’s Market open and sells on Friday’s Market close. You pay for my research, my time, and most of all the saving of your time. That’s why we have a summary of everything below right here:
🟢 The Buys:
Listen to this episode with a 7-day free trial
Subscribe to The Simple Side to listen to this post and get 7 days of free access to the full post archives.
The Saturday Sendout is tradeable market news in one place. Get weekly financial information on insider, company executive, and politician trading plus tons of other insights.
The Saturday Sendout is tradeable market news in one place. Get weekly financial information on insider, company executive, and politician trading plus tons of other insights.