No Investment Advice or Brokerage; Disclaimer. For the avoidance of doubt, The Simple Side does not provide investment, tax, or legal advice. The value of any asset class can go up or down and there can be a substantial risk that you lose money buying, selling, holding, or investing in any asset. You should carefully consider whether trading or holding assets is suitable for you in light of your financial condition.
If this is your first time here, welcome! If you’re one of the nearly 300,000 returning subscribers, welcome back — we are glad to have you all!
Before we get into today’s newsletter, I want to hear from you… yes you! Every newsletter I send has a quick survey you can use to request changes to the newsletter. Fill it out!
So far, we have made 27 updates thanks to your recommendations. So far, the most requested (and everyone’s favorite) has been this daily newsletter that sends updates on the market with fundamental and technical analysis for only $1 a month or $10 a year! Join by clicking here before the price increases to $5 a month and $60 annually!
PAID ACCESS ONLY — Thank you for all your support!
Stock Buy Summary
Mergers & Acquisitions Stocks
Top Stock Investment Ideas
Micro Cap Stock Picks
Earnings & Options
Updates & Developments
Current Developments
Copy Trading (Wednesday email with links will be sent to paying subscribers)
I have sent two emails to paying subscribers about their ability to copy trade with me on DoubleFinance. If you haven’t received an email from me, and you are a paying subscriber — reach out to me @ thesimplesidenews@gmail.com. I get a lot of emails so you might have to email a few times for me to catch it!
Stock/ ETF Scanner
I think we are only weeks away from finalizing our quick Stock Analysis Report. Below is a quick “sample” of what this will look like!
There are many more pieces of the website, like politician stock scanners, insider scanners, and more!
Updates
Our next paid subscriber raffle will be starting soon!! Last year we gave away over $4,000 in total to subscribers. Here’s one of the comments from one of last years winners:
My document on Google Sheets isn’t updating properly, so the graph above doesn’t show the proper values for this week, but does show proper values from last week.
Today marks the end of 3 quarters of reported and tracked weekly trades. That is 39 weeks of sending these weekly emails and reporting back on returns. Over those 39 weeks, we have outperformed the market and outperformed our own expectations… I am so extremely excited to see how we finish out the next quarter of weekly trades!
For weeks now, I have been telling subscribers that our weekly trades would be the portfolio to watch. In times of market uncertainty, smart traders have the advantage. Passive investing is the best investing style, but it loses when the market has drawdowns or high volatility.
I think it will remain the case until we see the markets get more stabilized. For the past 13 weeks, my weekly trades have averaged a 1.41% return. Over the same period of time the SPY has averaged a -0.56% return.
It sounds crazy, but it has all been tracked in real time through this newsletter and my paid subscriber spreadsheet:
I am continuing to DCA (investing weekly now) into my portfolios. I am adding less money than typical now as I am trying to avoid the current volatility.
Last week, I mentioned that WM and PM would be safe havens for people looking for less volatile, solid return companies. Last week, both companies had solid gains: WM returned +0.67% PM returned 5.19%
Weekly Trades Performance Weekly Picks Available After Paywall For Premium Subscribers
The graph shows the growth of a $10K investment which began on July 20, 2024. You can find every newsletter dating back to July 20th here by CLICKING HERE.
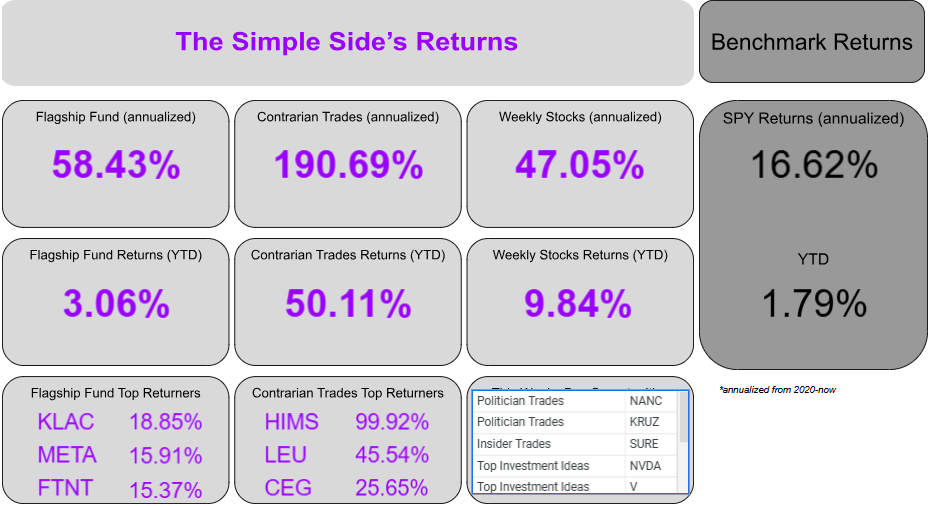
Here are the current performance metrics:
If you haven’t joined already, you can click the button below to join the paid newsletter and get these weekly picks sent to your inbox every Saturday!
Currently, the projected YTD market returns are still 1.9% — equal to last week’s expected 1.9% returns. This week in the markets, we saw what has been typical of this year: the SPY ending down over 2%. Interestingly, most stocks this week were actually up in the markets:
- 6743 stocks with gains - 2668 stocks with losses - The median return was +3.13%
I have been watching 2 stocks in the market as my gauge for overall sentiment: WM and PM. Both operate in “recession-proof” industries (although nothing is completely recession-proof): tobacco and waste management. No matter what happens in the markets, people are likely going to continue purchasing addictive substances, and people are likely going to continue to pay to have their trash removed.
If these companies continue to grow rapidly, then it means there is “smart money” behind the scenes that believes there is still downward pressure on the stock market.
As I have said every week, pay attention to earnings reports. Pay attention to the revised data metrics coming from the Fed as well. We likely won’t see the effects of tariffs this quarter, but if they are implemented before next quarter and earnings begin to fall, lots of stocks are in trouble.
Mohnish Pabrai (the “Warren Buffett” of India) believes that investing in what is “Hated and unloved” is the best road to success.
If you’re looking for sectors that investors currently hate, look at the following sectors, which have underperformed the market YTD and over the past month:
Communication Services — down -13.22% YTD Consumer Cyclical — down 20.93% YTD Technology — down 22.81% YTD Healthcare — down 25.24% YTD Real Estate — down 10.41% YTD Industrals — down 17.31% YTD Energy— down 14.50% YTD
Politician Trading Report
Politician trading matters… a lot. In 2024, the top-gaining politician was republican David Rouser, who returned 104.1%, followed closely by democrat Pelosi who returned 70.9% over the year.
This report tracks the five most recent politician trades and two large holdings in my portfolio — ETFs NANC 0.00%↑ (which tracks democrat trading) and GOP 0.00%↑ (which tracks republican trading).
NANC was +0.26% on the week, -5.27% this past month, and -11.41% YTD. GOP was +4.05% on the week, -6.73% this past month, and -8.72% YTD. For comparison, the SPY year-to-date is -10.58%.
Over the past 30 days, 24 politicians made 309 trades with a total trade volume of $6.50 million. The buy/sell ratio is up to 10.75, higher than last week’s value of 10. This shows continued bullish sentiment, which does come as a surprise given the current state of the markets. Seems the folks on The Hill believe in Trump’s plan.
Here are the 5 most recent politician trades:
Insider Trading Report
This report tracks the five largest insider buys from the past week and a new ETF in my portfolio — ticker SURE — which tracks insider trading.
SURE is +2.47% this week, -6.54% this month, and -10.22% YTD.
The monthly buy/sell ratio is up to 0.44 — higher than last week’s 0.40 — and above the 5-year average of 0.36. This indicates a slightly bullish sentiment from insiders.
Here are the 5 largest trades from this past week:
Here are two interesting transactions from the report above.
John B. Hess
RETURNS
Average 1-month return: 3.13%
Outperforming transactions: 6/10 (60%)
Average 3-month return: 7.05%
Outperforming trades: 4/10 (40%)
Average 1-year return: 19.37%
Outperforming trades: 7/10 (70%)
STOCK / PORTFOLIO
Goldman Sachs (GS) - Less than 1% of current portfolio
COMMENTARY
Based on the historical returns of Hess, the GS buy looks like it could return impressive results in the short and long-term, but could underperform in the mid-term. With the position being less than 1% of the portfolio, we will not be making any trades based on the stock purchase.
Arturo R. Moreno
RETURNS
Average 1-month return: 4.40%
Outperforming transactions: 3/3 (100%)
Average 3-month return: -1.68%
Outperforming trades: 1/3 (33%)
Average 1-year return: 18.67%
Outperforming trades: 1/1 (100%)
STOCK / PORTFOLIO
CCO - 98.25% of current portfolio
COMMENTARY
CCO looks criminally undervalued, but comes with an extreme risk setting. The price is very volatile and the company is carring debt levels that are far too extreme (cash-to-debt = 0.02), declining revenue, and they are issueing stock too. Does not look good for CCO… however, the company has had INCREDIBLE insider buying (even Steven Cohen is buying). This is a buy going into next week (paying subscriber see below), and may make an appearance in our “Contrarian Portfolio.”
Our premium subscribers get access to long-term, mid-term, and short-term strategies that all beat the market. You can too, join now!
Prior Week Callout Last weekend, we noted that ongoing trade‑war worries and a soft US Dollar would likely keep Gold anchored in the upper $3,000s, with support around $3,000–$3,050 acting as a strong floor.
This week’s action—first pushing to a fresh high near $3,357 and then ending comfortably above $3,300—confirms that outlook. The anticipated dip‑buying around those support zones materialized, and Gold’s uptrend remained intact despite profit‑taking and policy noise.
Our call on resilient safe‑haven demand and robust technical support proved accurate, reinforcing confidence in the metal’s broader bullish trajectory.
Technical Gold closed the week at $3,327.42, up over 2% after touching an intraday peak of $3,357. Despite a modest pullback, the pair maintained a bullish structure, posting both a higher high and a higher low.
It remains comfortably above all major moving averages, with the 20‑SMA currently at $3,114.60 acting as dynamic support. Key levels to watch on a shorter timeframe are $3,317.20, $3,305.65, and $3,292.80.
On the upside, immediate resistance stands at $3,335, then $3,350, and finally $3,375 if momentum persists.
Fundamental Safe‑haven flows dominated again as US‑China trade uncertainty lingered—and even intensified—throughout the week. After the ECB’s surprise rate cut and President Trump publicly chastising Fed Chair Powell over rate‑cut speed, markets grappled with mixed policy signals and growth concerns.
A softer US Dollar, pressured by rising recession fears and expectations for aggressive Fed easing, provided a supportive backdrop. Meanwhile, profit‑taking near record highs and ongoing tariff headlines kept traders cautious, helping to sustain Gold’s bid into the long Easter weekend.
Scenarios & Strategy
Bullish continuation: If geopolitical tension or dovish Fed bets intensify further, Gold could clear $3,335 and test $3,350. A decisive push above that could extend toward $3,375.
Consolidation: In the absence of new catalysts, Gold may trade sideways between $3,305 and $3,350, digesting recent gains.
Pullback: A stronger US Dollar or hawkish Fed rhetoric could see Gold retest $3,305–$3,292. A break below $3,292 would open the door to the 20‑SMA near $3,115.
Trading Plan for Next Week
Buy (Entry) Zones: Look to initiate long positions on pullbacks into $3,317–$3,305, where previous buyers have stepped in.
Stop-Loss: Place protective stops just below $3,292 to limit downside risk if the support zone fails.
Take-Profit:
Target 1: $3,335 (near-term resistance)
Target 2: $3,350 (round-number resistance)
Target 3: $3,375 (stretch objective, aligns with higher pivot)
Alternative Breakout Approach: Should Gold decisively close above $3,335, consider fresh longs with a stop at $3,305 and targets at $3,350 and $3,375.
Risk Management: Limit individual position size so the stop-loss risk represents no more than 1–2% of trading capital. Adjust take-profit levels if major data releases or trade headlines are due.
Monitoring: Keep an eye on US economic releases (e.g., PPI, UoM inflation expectations) and any trade‑war developments, as they can trigger rapid shifts in both the Dollar and Gold.
The Weekly Stock Summary: OXY
This week we discussed Occidental Petroleum—a Houston‑based oil and gas explorer and producer with nearly 4 billion barrels of oil equivalent in reserves and 1.3 million boe/day of production in 2024. With a balanced mix of 50% oil/NGLs and 50% natural gas, Occidental is positioned to smooth out commodity swings. Analysts see roughly 74% upside to their $73.25 average price target, and my models peg fair value at about $72. Buffett’s Berkshire holds nearly 25% of the company.
Here’s how Occidental fares on our five Buffett‑style criteria:
Understandable Business Model:Pass ✅ Simple “find, drill, and sell” operations across oil, gas, and chemicals, diversified by geography and commodity to stabilize earnings.
Proven Earnings:Pass ✅ Strong 2024 operating margin (27.6%) and net margin (~15%), with disciplined cost control delivering robust cash flows despite cyclical energy markets.
Economic Moat:Fail ❌ While its vast reserves and Permian Basin position are advantages, ROIC (5.5%) slightly trails WACC (6.3%), and there’s no clear, enduring barrier that keeps competitors at bay.
Low Debt Growth:Pass ✅ Debt/Equity near 1.0 (down from post‑Anadarko highs), Debt/EBITDA of 1.3×, and interest coverage above 8× reflect prudent leverage management.
Fair or Undervalued:Pass ✅ Trading around $42, Occidental’s P/E (~15.5), P/B (1.37), and PEG (~0.06) signal significant undervaluation versus intrinsic values near $72–$74.
Simple Score: 8.9/10 Occidental’s clear business model, strong margins, conservative balance sheet, and deep undervaluation align well with Buffett’s principles—making it a compelling long‑term value pick despite the inherent volatility of energy markets.
Paying subscribers, all of your info and analysis are below! Enjoy, and I will see you all next weekend. Look for educational emails and copy trading announcements coming in this week.
If you want access to it all, join before prices soar (just like your account will with The Simple Side). JOIN HERE or click the buttons below.
This is where I bring you a curated list of stocks my model says offer the best upside with the least potential for loss this week. Of course, I will report on all of the stocks weekly, but that doesn’t mean you need to buy all of them or any of them every week. Do your own diligence, and you might just outperform me!
Quick PSA: We treat the trades as buys on Monday’s Market open and sells on Friday’s Market close. You pay for my research, my time, and most of all the saving of your time. That’s why we have a summary of everything below right here:
The Saturday Sendout is tradeable market news in one place. Get weekly financial information on insider, company executive, and politician trading plus tons of other insights.
The Saturday Sendout is tradeable market news in one place. Get weekly financial information on insider, company executive, and politician trading plus tons of other insights.