No Investment Advice or Brokerage; Disclaimer. For the avoidance of doubt, The Simple Side does not provide investment, tax, or legal advice. The value of any asset class can go up or down and there can be a substantial risk that you lose money buying, selling, holding, or investing in any asset. You should carefully consider whether trading or holding assets is suitable for you in light of your financial condition.
If this is your first time here, welcome! If you’re one of the nearly 300,000 returning subscribers, welcome back — we are glad to have you all!
Before we get into today’s newsletter, I want to hear from you… yes you! Every newsletter I send has a quick survey you can use to request changes to the newsletter. Fill it out!
So far, we have made 27 updates thanks to your recommendations. So far, the most requested (and everyone’s favorite) has been this daily newsletter that sends updates on the market with fundamental and technical analysis for only $1 a month or $10 a year! Join by clicking here before the price increases to $5 a month and $60 annually!
I have sent three emails to paying subscribers about their ability to copy trade with me on DoubleFinance. If you haven’t received an email from me, and you are a paying subscriber — reach out to me @ thesimplesidenews@gmail.com. I get a lot of emails so you might have to email a few times for me to catch it!
There are many more pieces of the website, like politician stock scanners, insider scanners, and more!
Updates
Our next paid subscriber raffle will be starting soon!! Last year we gave away over $4,000 in total to subscribers. Here’s one of the comments from one of last years winners:
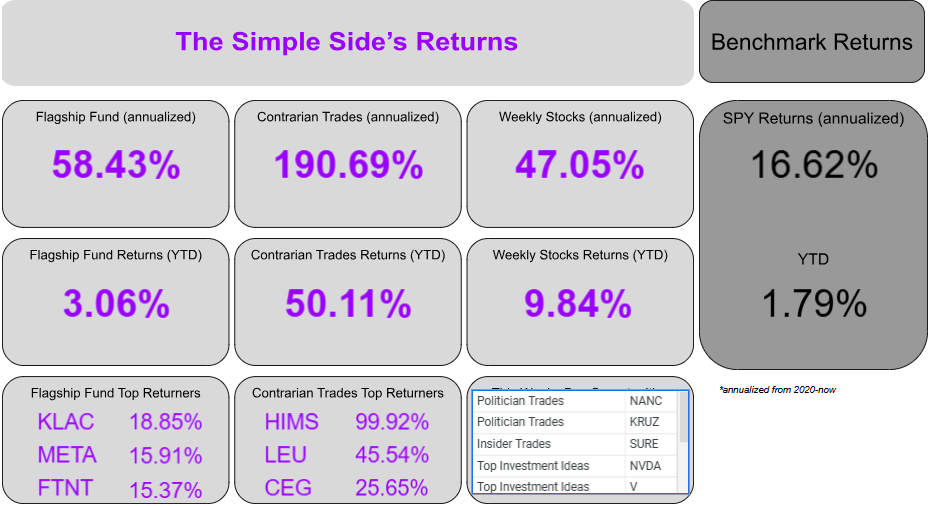
Today marks the first week into the 4th quarter of reported and tracked weekly trades. That is 40 weeks of sending these weekly emails and reporting back on returns. Over those 40 weeks, we have outperformed the market and outperformed our own expectations… I am so extremely excited to see how we finish out the next quarter of weekly trades!
For weeks now, I have been telling subscribers that our weekly trades would be the portfolio to watch. In times of market uncertainty, smart traders have the advantage. Passive investing is the best investing style, but it loses when the market has drawdowns or high volatility.
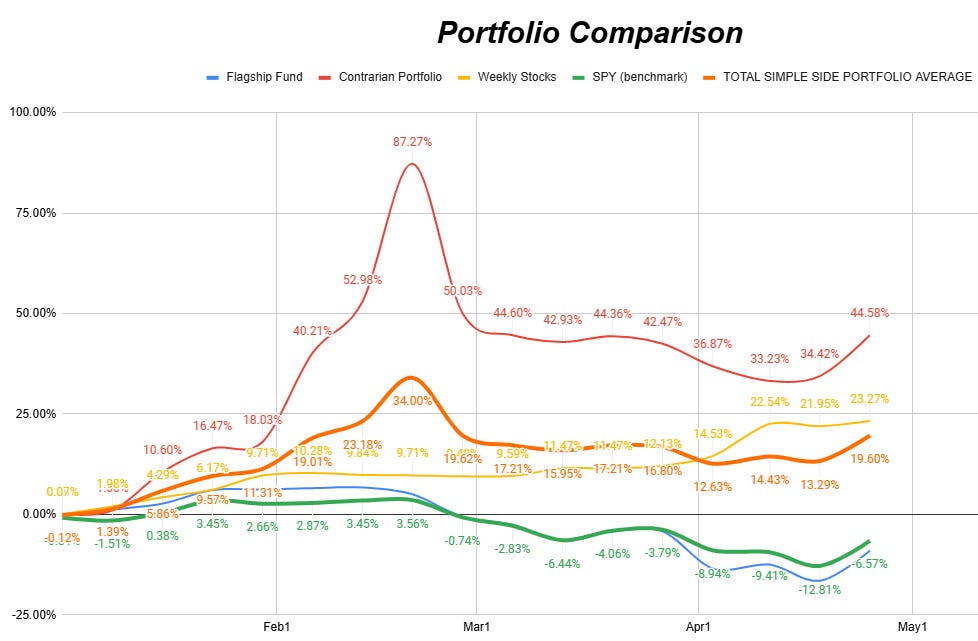
I think it will remain the case until we see the markets get more stabilized. For the past 13 weeks, my weekly trades have averaged a 1% return. Over the same period of time the SPY has averaged a -0.56% return.
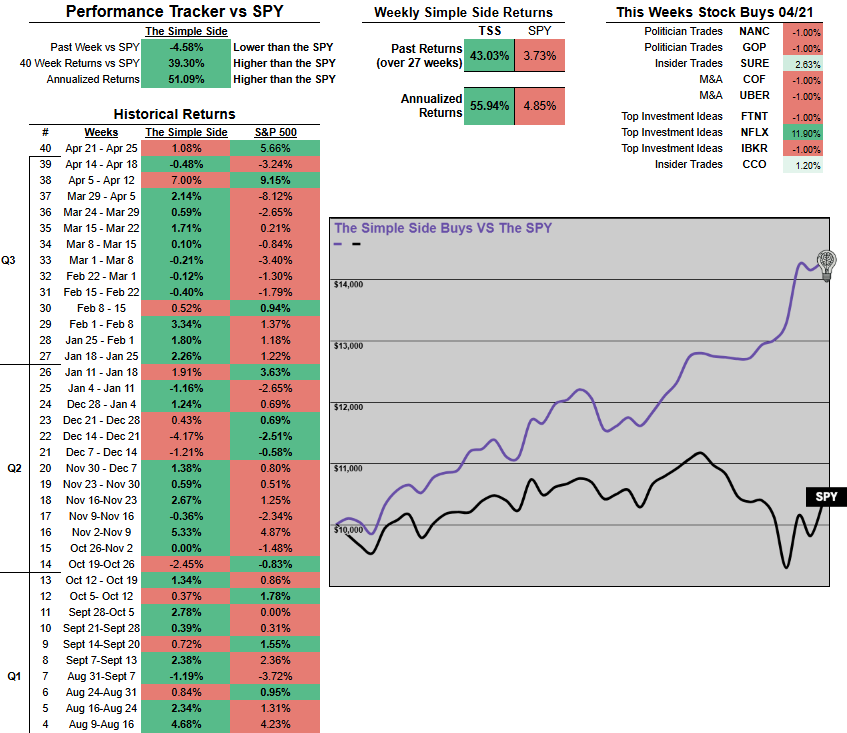
It sounds crazy, but it has all been tracked in real time through this newsletter and my paid subscriber spreadsheet:
I am continuing to DCA (investing weekly now) into my portfolios. I am adding less money than typical now as I am trying to avoid the current volatility.
Weekly Trades Performance Weekly Picks Available After Paywall For Premium Subscribers
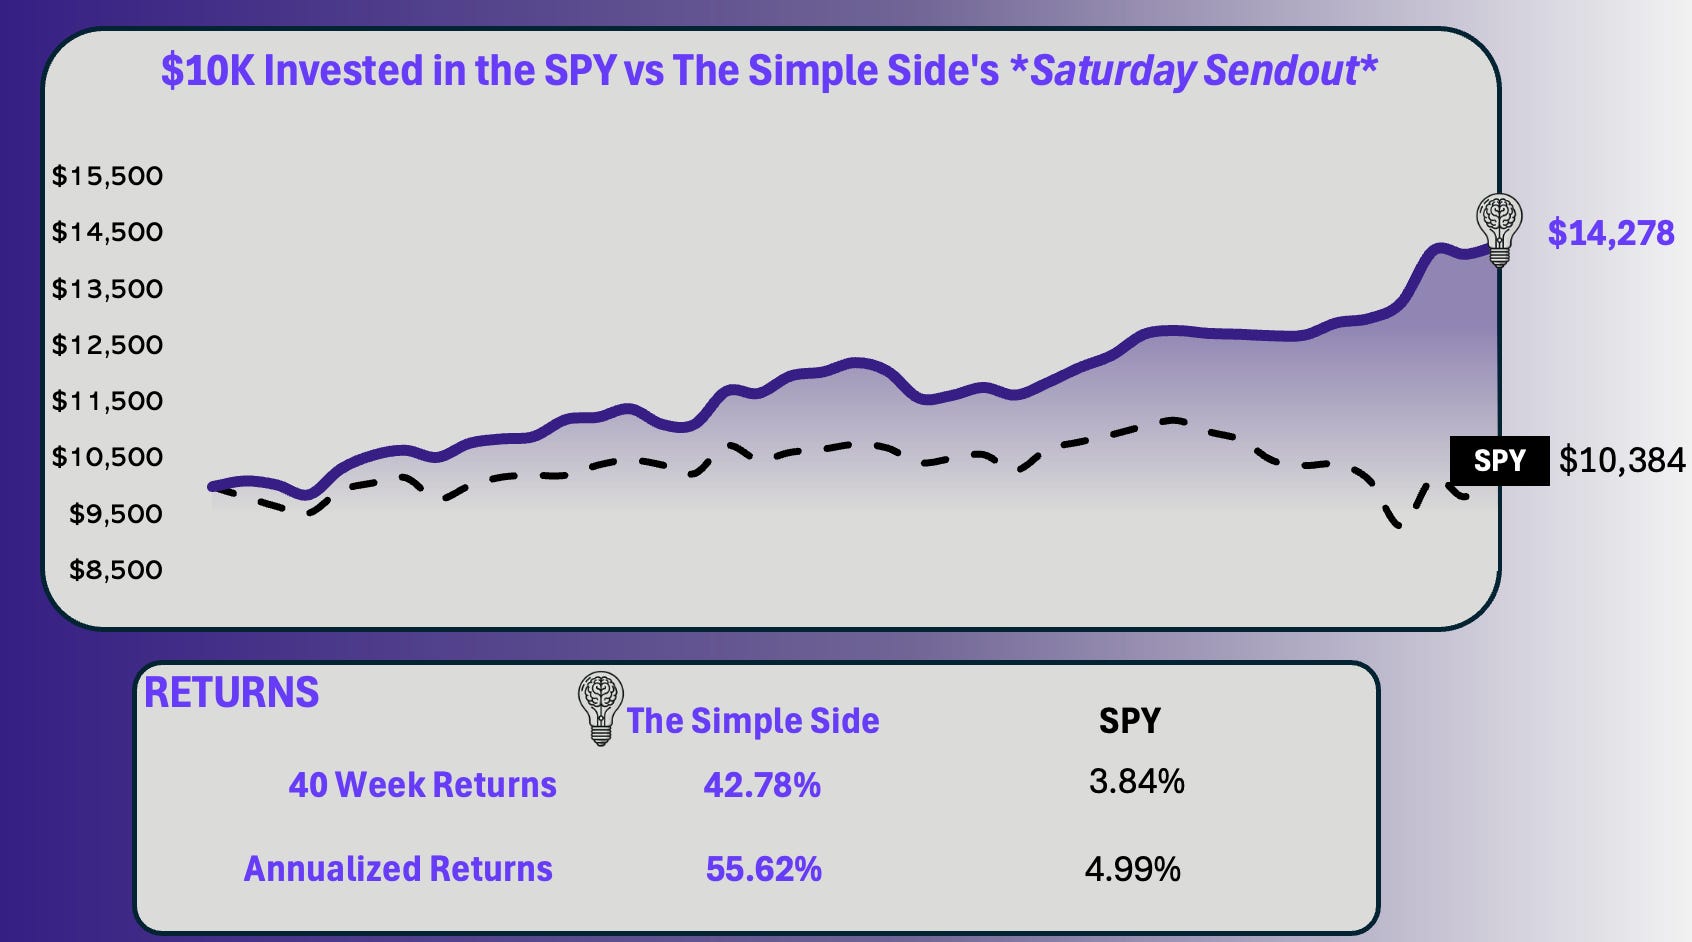
The graph shows the growth of a $10K investment which began on July 20, 2024. You can find every newsletter dating back to July 20th here by CLICKING HERE.
Here are the current performance metrics:
If you haven’t joined already, you can click the button below to join the paid newsletter and get these weekly picks sent to your inbox every Saturday!
Currently, the projected 1-year market returns are 1.4% — lower than last week’s expected 1.9% returns. This week in the markets, we saw what has been a-typical of this year: the SPY ending up — no complaints here!
- 6681 stocks with gains - 2729 stocks with losses - The median return was +2.97%
What a wild ride it has been. We are up and then down and then up and then… I mean, I didn’t know I could run out of breath typing, but geez! The best thing to do right now is look at your actions over the past couple of weeks.
Were you stressed about your portfolio? Were you constantly checking values? Or, were you uninterested — confused why everyone else around you was freaking out.
This is your risk tolerance talking to you like God does at Sunday church. If you were freaking out then you are either: 1. Overexposed to the market and you need to pull some capital out. 2. Over-invested in risky assets and need to supplement them with less volatile assets.
The good news is that both of these issues have solutions, and easy ones at that and you know what they are.
A great solution for anyone who is nervous about the the current state of the economy is to supplement your portfolio with 2 “subsets” of holdings. One being the risky assets, the other being safe, long-term assets. The combo of these strategies can lead to massive outperformance of returns!
I would like to take a few seconds to discuss something that I have seen trending, and I think the trade will soon be exposed to the public. That trade is energy.
Oil has been getting hammered recently, and energy itself is down nearly 12% YTD — one of the worst performing industries in the market. However, I see bountiful buying from people like Buffett (with OXY) and Dalio (with VST). I also see Mohnish Pabrai buying his coal stock with a 144% increase in 2024.
I am watching closely here, very closely. I will soon be sending a new contrarian trade article out. It is going to be VERY contrarian, but I believe the risk/reward ratio to be in the right spot to instigate these trades.
Mohnish Pabrai (the “Warren Buffett” of India) believes that investing in what is “Hated and unloved” is the best road to success.
If you’re looking for sectors that investors currently hate, look at the following sectors, which have underperformed the market YTD and over the past month:
Consumer Cyclical — down 20.93% YTD Technology — down 22.81% YTD Healthcare — down 25.24% YTD Industrials — down 17.31% YTD Energy— down 14.50% YTD
Politician Trading Report
Politician trading matters… a lot. In 2024, the top-gaining politician was republican David Rouser, who returned 104.1%, followed closely by democrat Pelosi who returned 70.9% over the year.
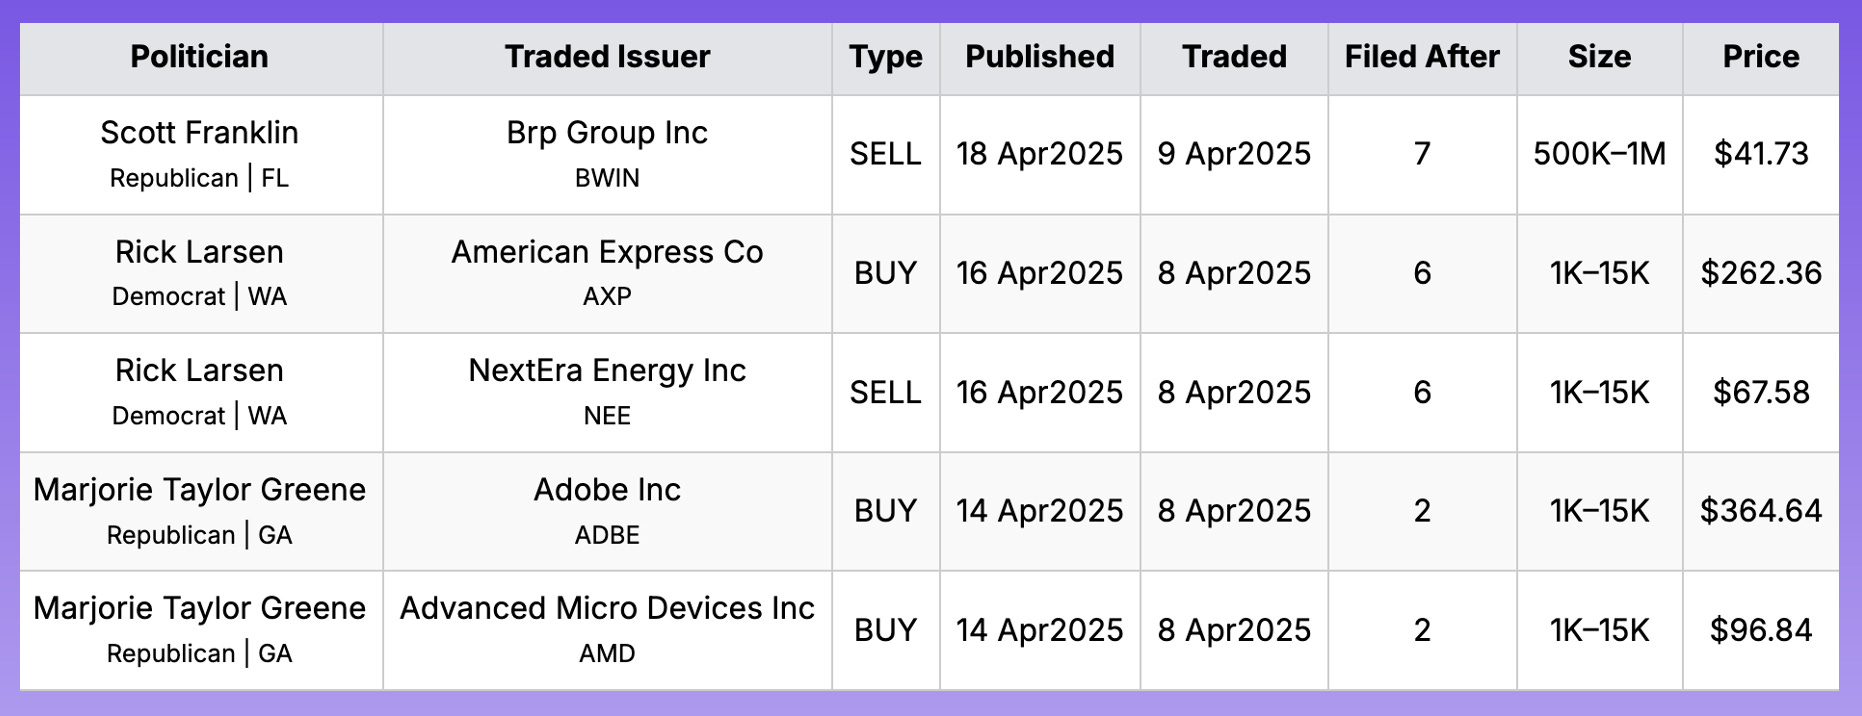
This report tracks the five most recent politician trades and two large holdings in my portfolio — ETFs NANC 0.00%↑ (which tracks democrat trading) and GOP 0.00%↑ (which tracks republican trading).
NANC was +6.93% on the week, -1.63% this past month, and -5.92% YTD. GOP was +4.76% on the week, -2.95% this past month, and -3.97% YTD. For comparison, the SPY year-to-date is -5.82%.
Over the past 30 days, 23 politicians made 207 trades with a total trade volume of $5.10 million. The buy/sell ratio is down drastically to 2.57, much lower than last week’s value of 10.5. This shows a slowdown of the politician's bullish sentiment. Interesting how, for the past few weeks, we saw politicians buying at never-before-seen levels, and now the market is up multiple weeks in a row. Seems the folks on The Hill are the perfect people to watch when the markets take a turn.
Here are the 5 most recent politician trades:
Insider Trading Report
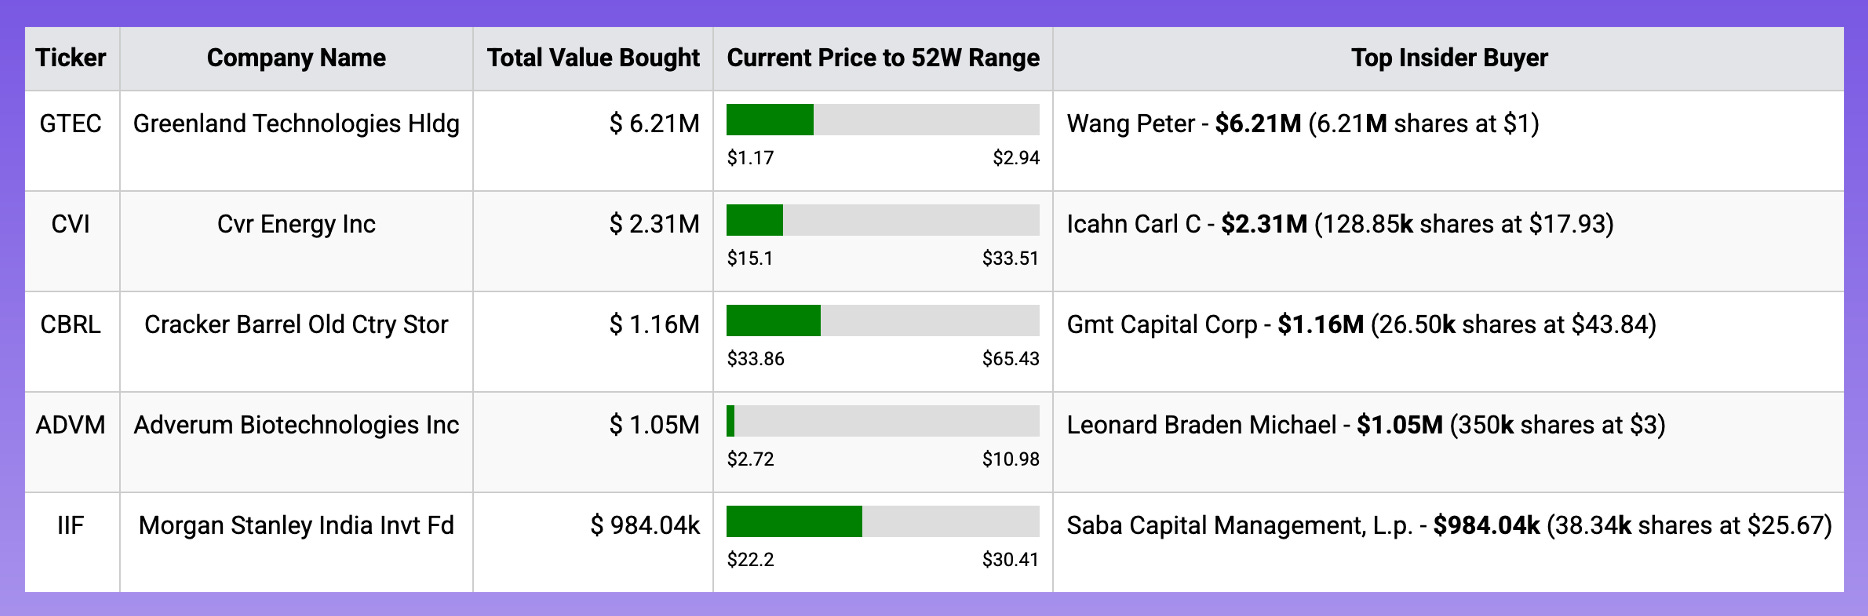
This report tracks the five largest insider buys from the past week and a new ETF in my portfolio — ticker SURE — which tracks insider trading.
SURE is +2.06% this week, -3.43% this month, and -7.07% YTD.
The monthly buy/sell ratio is up to 0.49 — higher than last week’s 0.44 — and above the 5-year average of 0.36. This indicates a slightly bullish sentiment from insiders.
Here are the 5 largest trades from this past week:
Here are two interesting transactions from the report above.
Carl Icahn
RETURNS
Average 1-month return: 4.62%
Outperforming transactions: 125/197 (63%)
Average 3-month return: 10.68%
Outperforming trades: 142/187 (76%)
Average 1-year return: 25.08%
Outperforming trades: 130/167 (78%)
STOCK / PORTFOLIO
CVR Energy (CVI) - Less than 5% of current portfolio
COMMENTARY
Based on Icahn’s past returns, it looks like purchasing CVI could be profitable. He purchased shares for $17.93 a share and has already made a profit of 2.62% as the stock is now at over $18. CVI as a company doesn’t look great or awful. I see large amounts of debt on the balance sheet and very volatile revenue as is typical with oil/gas stocks. I also see a low ROIC but overall you could argue that the stock is undervalued based on Shiller PE and price to porject FCF. Either way, this is a stock I am going to stay away from.
Saba Capital Mgmt.
RETURNS
Average 1-month return: 1.93%
Outperforming transactions: 1429/2041 (70%)
Average 3-month return: 3.99%
Outperforming trades: 1427/2006 (71%)
Average 1-year return: 9.36%
Outperforming trades: 1108/1537 (72%)
STOCK / PORTFOLIO
IIF - < 1% of current portfolio
COMMENTARY
Looking at Saba’s trades gives great insight into why you need to be particular about the companies and insiders you choose to copy trade/ follow. You might see a purchase of something like an “India focused ETF” and think that it is the time to bet on India… wrong. Saba owns TONS of different funds and ETFs plus they are underperforming (at least in the short term) — returns are in line with the SPY longer term, but why would you want to make 1500 trades just to be average?
Our premium subscribers get access to long-term, mid-term, and short-term strategies that all beat the market. You can too, join now!
Prior Week Callout Last week we anticipated that lingering trade-war jitters would keep Gold buoyed above the $3,000–$3,050 zone, with any dips into that area offering attractive buying opportunities. Indeed, Gold spiked to $3,357 before retracing and holding firm above $3,300, validating our call on robust safe-haven demand and responsive dip-buying around key supports.
Technical Gold has pulled back from its recent highs and is trading near $3,260. The daily Pivot at $3,335 remains the first hurdle to reclaim on any rally, followed by R1 at $3,381 and R2 at $3,414. On the downside, S1 at $3,302 has briefly given way but reclaimed as support, while S2 at $3,256 and the April 11 high near $3,245 form a critical floor. A break below $3,245 would expose the 20-day SMA closer to $3,115, signaling a deeper correction.
Fundamental Optimism over US–China trade talks—which President Trump and Treasury Secretary Scott Bessent have both publicly hinted at—has improved market sentiment, reducing immediate safe-haven flows into Gold. Bloomberg reports that China may exempt some US goods from tariffs, and is preparing “shock-absorber” financial tools, further dampening urgency to buy Gold. Nevertheless, ETF inflows remain strong, and any reversal of these trade-deal hopes could swiftly rekindle demand.
Scenarios & Strategy
Bullish Rebound: If trade-deal optimism fades, Gold could reclaim the Pivot at $3,335, test $3,381, and even challenge $3,414.
Sideways Consolidation: With no clear catalyst, expect a trading range between $3,256 and $3,335 as markets weigh fresh headlines.
Deeper Pullback: A sustained break below $3,245 would open the door to the 20-SMA near $3,115.
Trading Plan for Next Week
Entry Zone: $3,302–$3,256 (retest of S1/S2)
Stop-Loss: Below $3,245 (just under critical floor)
Take-Profit:
$3,335 (daily Pivot)
$3,381 (R1)
$3,414 (R2)
Breakout Alternative
If Gold closes above $3,335 with conviction, consider fresh longs with a stop at $3,302 and targets at $3,381 and $3,414.
Position size should cap risk at 1–2% of account equity. Monitor US–China trade headlines and any shifts in ETF flows or central-bank commentary for rapid adjustments.
This week we tackled the challenge Peter Lynch posed—scouring thousands of stocks from A–Z—and introduced a smarter solution: The Simple Side’s new AI agent on agent.ai, your personal stock research assistant.
The Problem:
Lynch recommended analyzing every stock, but at one per hour, eight hours a day, it would take four years to cover 12,000 tickers.
Hiring analysts is costly and still time-consuming.
Off-the-shelf AI tools are often inaccurate and require heavy oversight.
The Solution—Our AI Agent:
Speed: Cuts research time by 98%, instantly retrieving the latest filings and financials for any ticker you type.
Objectivity: Removes emotion from investing—just data-driven rankings.
Custom Ranking System: Scores each stock on a 1–10 scale (5 = average) across two main pillars:
Fundamental Health
Profitability
Growth
Valuation
Financial Health
Economic Moat
Measures competitive advantages vs. industry peers
How It Works:
Data Collection: Pulls current and one-year-old company financials plus industry averages.
Fundamental Analysis: Compares 12 key metrics (current vs. historical), adjusts a baseline 5/10 score up or down based on improvement or decline.
Moat Analysis: Compares those same metrics to industry norms, tweaking the score around the 5/10 midpoint.
Result: A single, intuitive score tells you at a glance whether a stock is below, at, or above average.
Real-World Example:
We looked at Fidelity’s $153 million purchase of F&G Annuities & Life (FG).
Our agent rated FG a 7.5/10, with its strongest marks in Profitability and Valuation—saving us hours of manual screening and zeroing in on a potentially high-conviction idea.
Paying subscribers, all of your info and analysis are below! Enjoy, and I will see you all next weekend. Look for educational emails and copy trading announcements coming in this week.
If you want access to it all, join before prices soar (just like your account will with The Simple Side). JOIN HERE or click the buttons below.
This is where I bring you a curated list of stocks my model says offer the best upside with the least potential for loss this week. Of course, I will report on all of the stocks weekly, but that doesn’t mean you need to buy all of them or any of them every week. Do your own diligence, and you might just outperform me!
Quick PSA: We treat the trades as buys on Monday’s Market open and sells on Friday’s Market close. You pay for my research, my time, and most of all the saving of your time. That’s why we have a summary of everything below right here:
🟢 The Buys:
Listen to this episode with a 7-day free trial
Subscribe to The Simple Side to listen to this post and get 7 days of free access to the full post archives.
The Saturday Sendout is tradeable market news in one place. Get weekly financial information on insider, company executive, and politician trading plus tons of other insights.
The Saturday Sendout is tradeable market news in one place. Get weekly financial information on insider, company executive, and politician trading plus tons of other insights.