


No Investment Advice or Brokerage; Disclaimer. For the avoidance of doubt, The Simple Side does not provide investment, tax, or legal advice. The value of any asset class can go up or down and there can be a substantial risk that you lose money buying, selling, holding, or investing in any asset. You should carefully consider whether trading or holding assets is suitable for you in light of your financial condition.

Happy Saturday simple investor! See below for some quick updates before we get into this week's returns — which outperformed the S&P 500 again!
Quick Updates
Typically these posts are paywalled but today I decided to do something different.. this entire post is free. Get a never before seen look into what Simple Side Paying subscribers get to see every week!
If you like quick, short-form stock updates and analysis daily, check out my daily newsletter (only costs $10 a year or $1 a month).
(LINK) Paying subscribers have access to the $2,000 giveaway in December!
Copy Trading and Profit Sharing For Paying Subscribers
The homepage of my website has been rearranged. I am in the process of adding missing posts. I now have the following sections:
I will be doing a podcast Q&A to answer any and all questions that people have emailed to me or that they have sent to me with the button below!
Feel free to send me an email by replying to this message, or emailing my other email: thesimplesidenews@gmail.com.
You can also click the button below and let me know anonymously about anything!
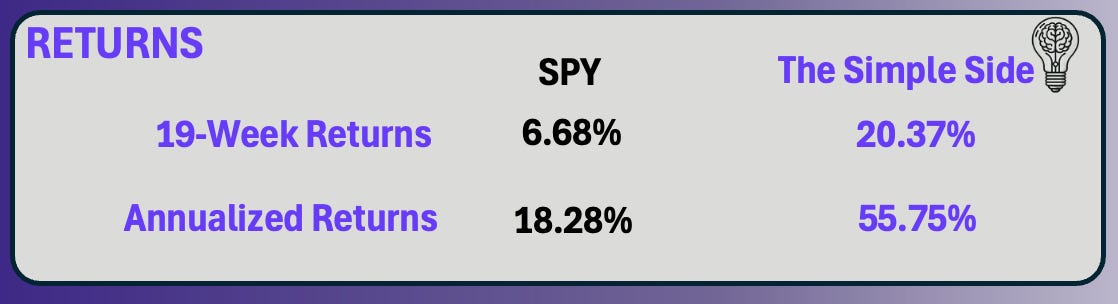
Past Performance: Averaging 1.07% Weekly
This section of the newsletter tracks the past performance of this weekly newsletter. As you will see, we have (on average) outperformed the S&P 500 from Monday to Friday, market open to market close. Take a look:
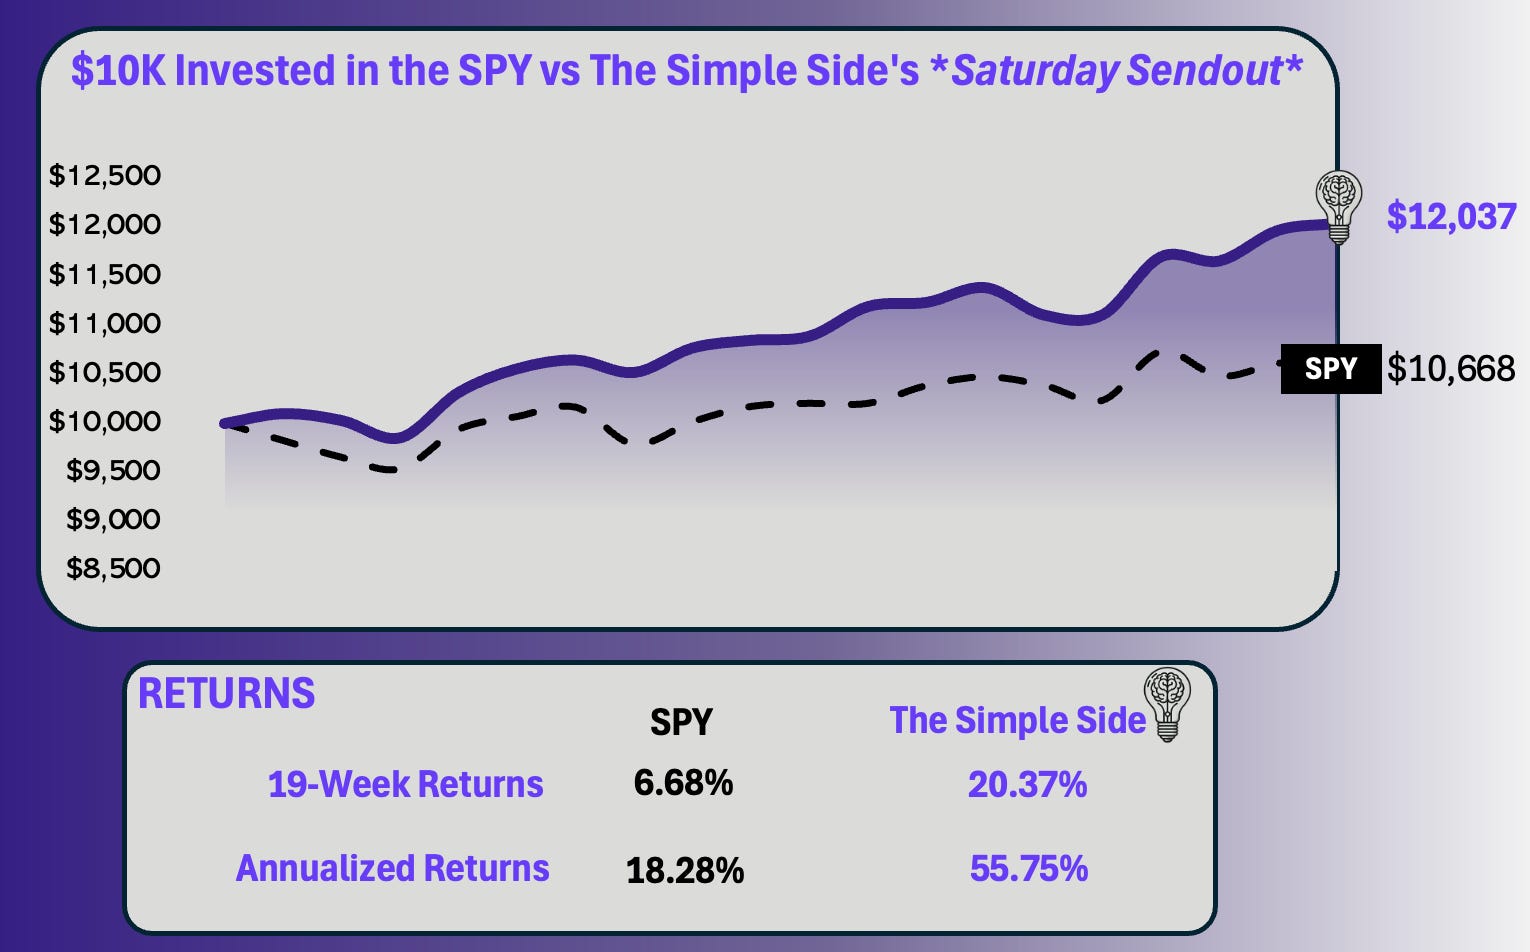
The graph shows the growth of a $10K investment which began on July 20, 2024. You can find every newsletter dating back to July 20th here by CLICKING HERE.

Here is a summary of the past few weeks of performance and a comparison of returns that this newsletter has had relative to the SPY.

If you haven’t joined already, you can click this button below to join the paid newsletter and get these weekly picks sent to your inbox every Saturday!

Today’s Reporting Information
[FREE EDITION]
Quick Overview
Politician Trading Report
Politician Stock Highlight
Insider Trading Report
Insider Stock Highlight
Executive Trading Report
Executive Stock Highlight
Investing for Next Week (For Paying Subscribers)
Next Week’s Buy Opportunities
Mergers and Acquisitions
Top Investment Ideas
Contrarian Bets
Flagship Portfolio Updates
Micro-Cap Picks *NEW*
Expected Stock Movements From Options Trading *NEW*
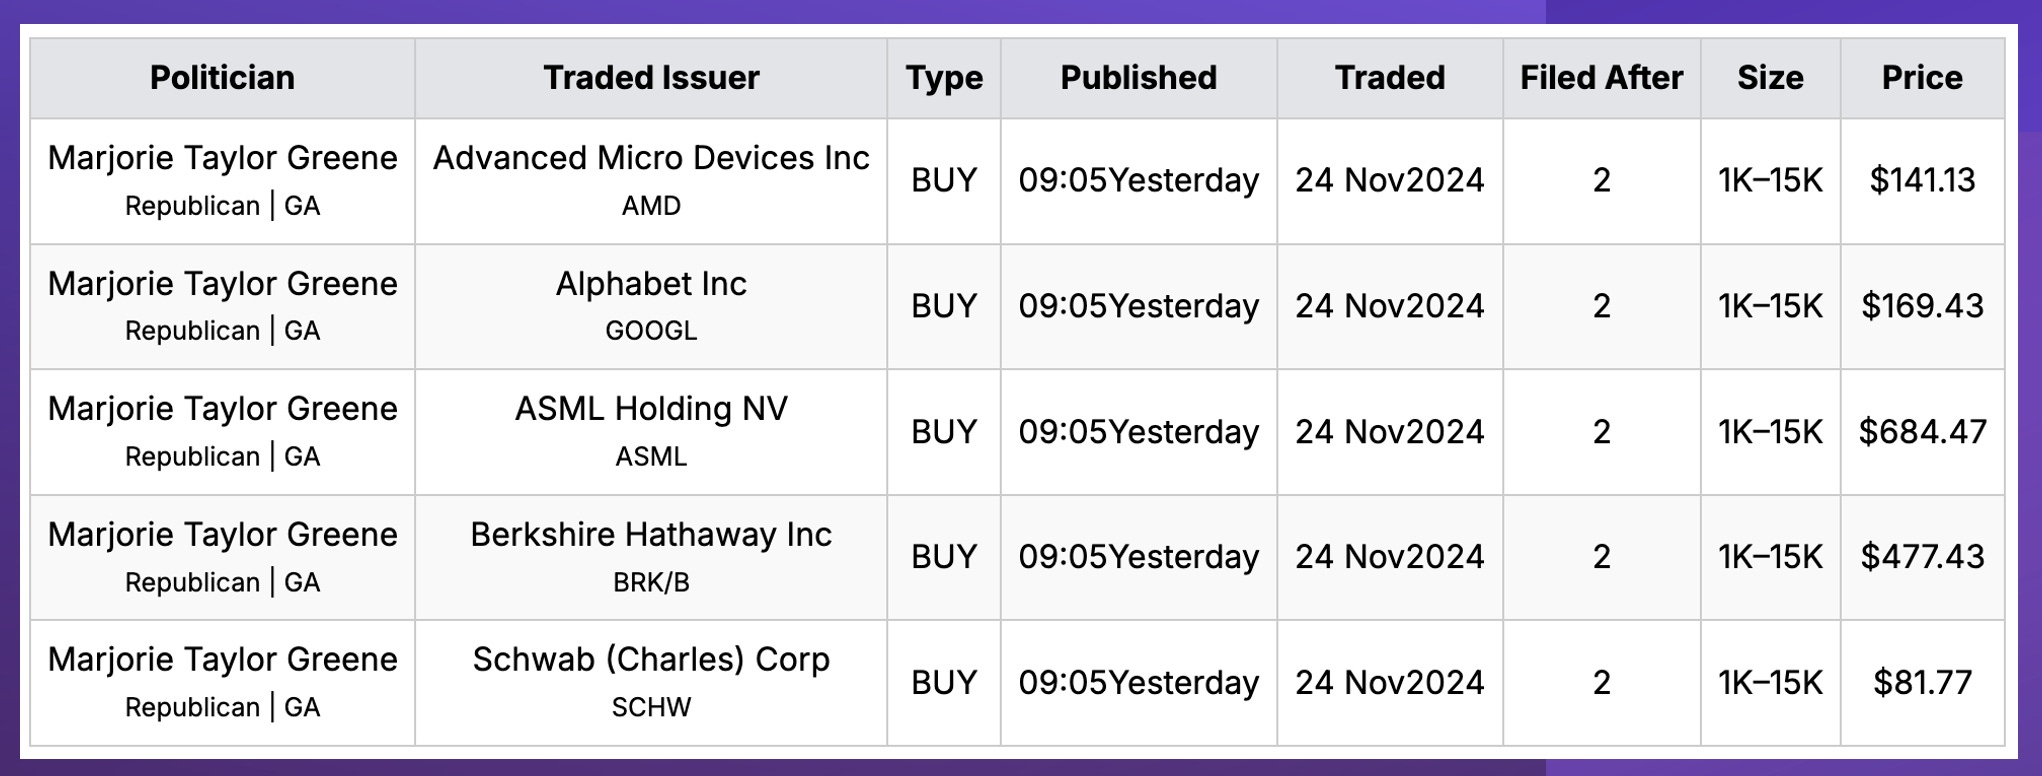
Politician Trading Report
This report tracks the five most recent politician trades and two large holdings in my portfolio — ETFs NANC 0.00%↑ (which tracks democrat trading) and KRUZ 0.00%↑ (which tracks republican trading).
NANC is up 0.18% this week, 4.06% this past month, and 32.07% YTD.
KRUZ is up 0.03% this week, 5.62% this past month, and 21.87% YTD.
Contributing to these gains — over the past 30 days — 12 politicians have made 73 trades investing over $950 thousand.
Politician Stock Highlight
This is the third week in a row that Marjorie Taylor Green decided to buy like it’s going out of style. As is typical, her purchases remained within the 1K-15K range.
Now Marjorie tends not to have anything interesting within her great group of purchases, however, this week one stock stands out: GSK PLC (ticker: GSK). I ran a historically based discounted cash flow analysis and I believe the stock has an 11% upside potential. My personal stock price predictor has the stock in undervalued territory by a margin of 22%, and analysts have the stock at a 23% upside rating. All of that combined caught my eye. The company has been aggressively paying down debt since 2019, has a great return on invested capital, and started buying shares back in 2023. For all of these reasons, I see the stock as a 🟢Buy Opportunity🟢 (more of these are available for paying subscribers below).
Here are the most recent politician trades:
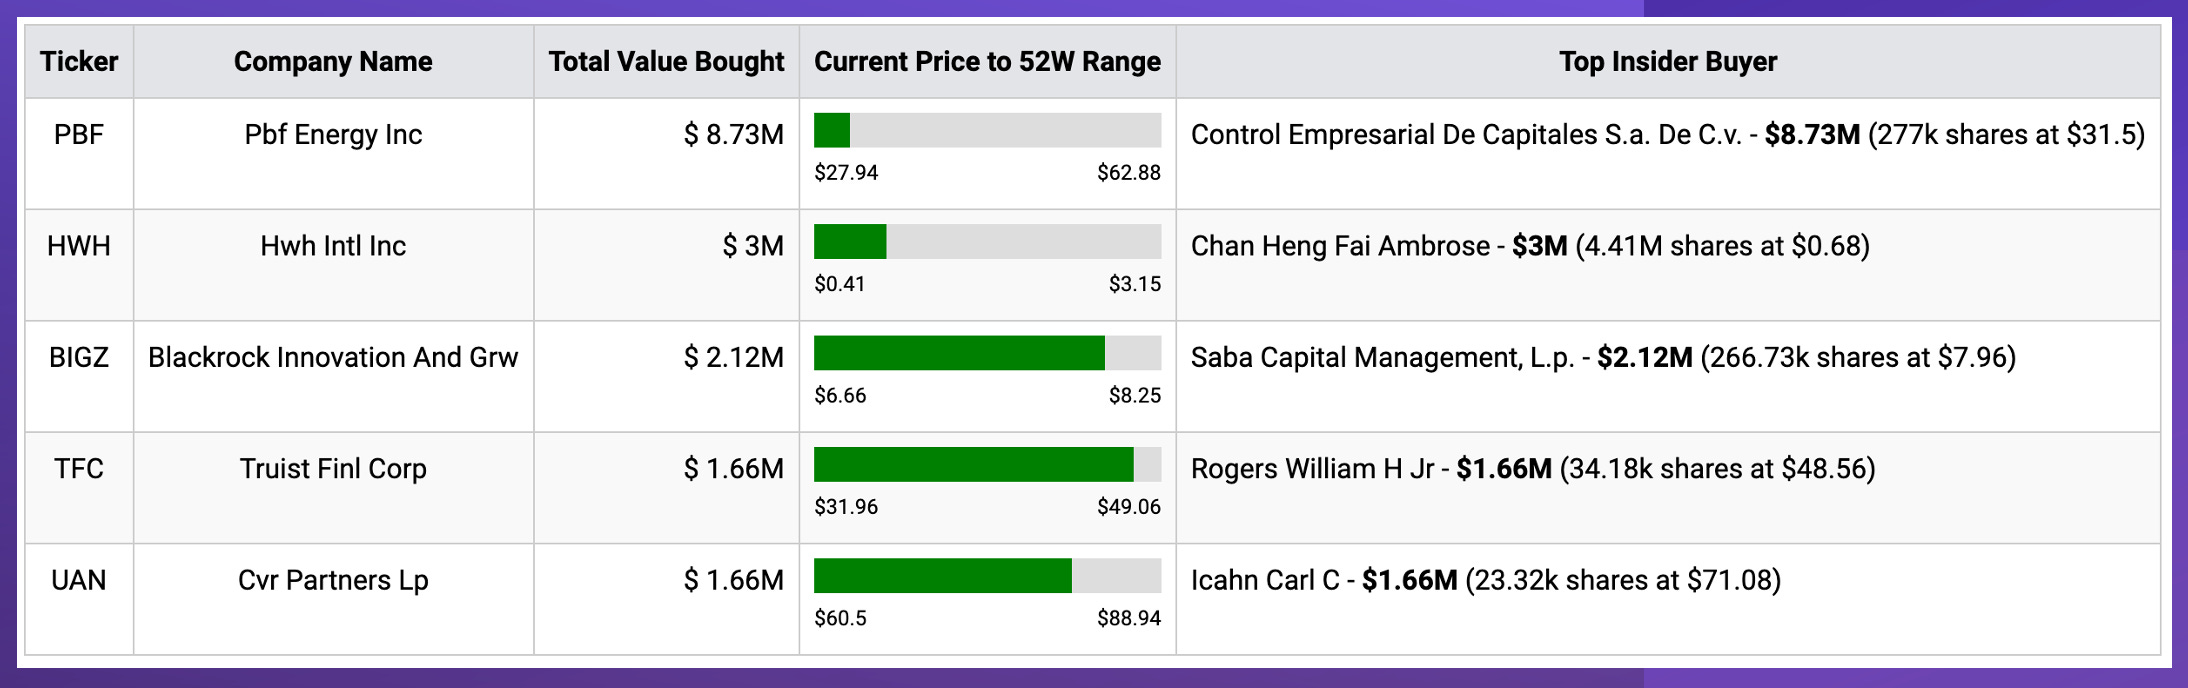
Insider Trading Report
This report tracks the five largest insider buys from the past week and a new ETF in my portfolio — ticker SURE — which tracks insider trading.
SURE is up 3.30% this week, 6.64% this month, and 20.28% YTD.
Insider Stock Highlight

There is one stock that we cannot seem to escape from when it comes to insider trading and that stock is PBF Energy (ticker: PBF). Last week we took a look at PBF and said the stock would be on our watchlist but wasn’t a conviction buy. The stock lost 1% last week. You can see the quick one-pager we made last week above. While the metrics don’t look disparaging, they certainly do not look attractive. There is one thing about PBF that has me nervous: their revenue per share.
Their revenue per share has dropped over the past 12 months. This to me shows a direct correlation to poor management within a company. Well, that or the company is facing some serious growth issues. But look at this ridiculous graph showing insider ownership within the company over the past decade. You would think that with so many insiders holding stock the comapny would be focused on growing their revenue, but this hasn’t been the case.
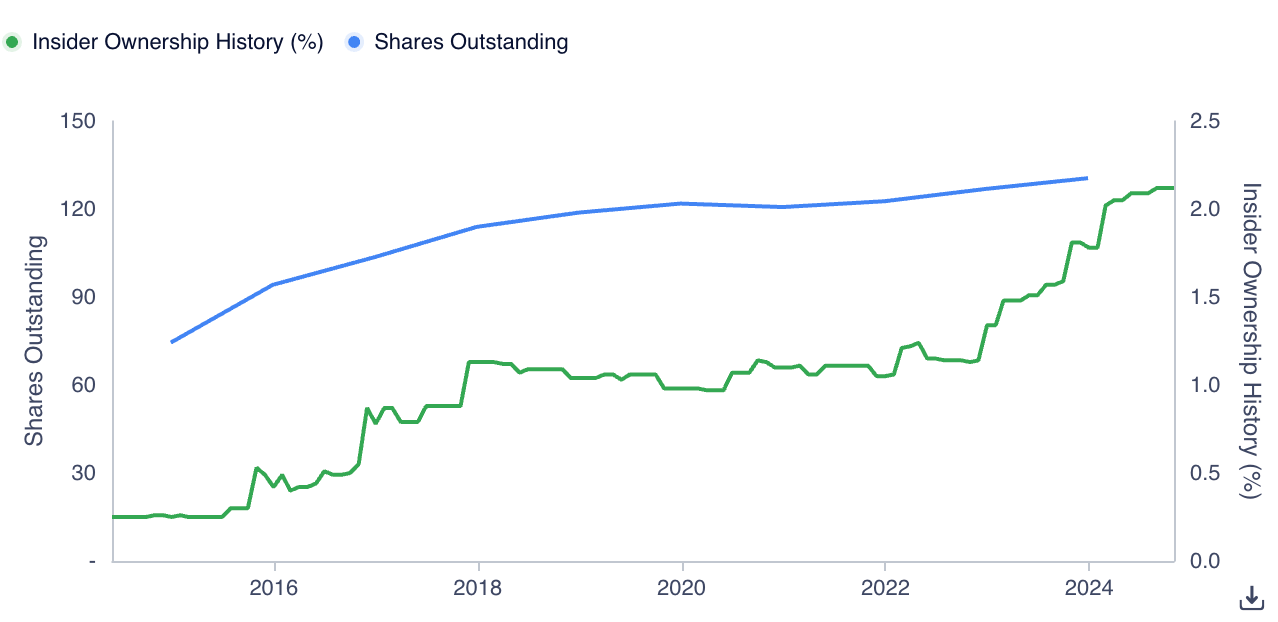
The company’s overall rating dropped from a 7.0/10 to a 6.9 based on my analysis. I want to back this stock so badly given the insider buying, but I need to see some strategic growth plans or partnerships happen before I can be certain about the company’s performance. No rating this week.
Here are the largest trades from this past week:
Our premium subscribers get access to long-term, mid-term, and short-term strategies that all beat the market. You can too, join now!
Executive Trading Report
This report tracks the five most recent stock trades from company executives.
Total executive ownership in our top 5 companies grew by over 289% — one of the highest growth weeks we have had.
The largest increase came from a director at Walmart (ticker WMT). They increased their ownership by +231% at a purchase price of $91.81 and the stock currently sits at $92.60 a +0.86% change.
Executive Stock Highlight
Walmart isn’t the stock I want to highlight this week (my models put the stock at an overvaluation of 60%…). The stock I do want to take a look at is Myers Industries (MYE). The company is an interesting one and currently sits at 40% undervalued with a stock ranking of 7.5/10 based on my model’s valuation. The DCF says 32% undervalued and analysts say there is an 89% upside.
So, math and analysts say the company is a buy, but what are the company’s warning signs? Well, over the past 12 months, we have seen revenue per share drop, and the return on invested capital decrease while the weighted average cost of capital increased… did that make your brain hurt? Mine too — basically, the comapny isn’t as efficient with its money as it once was. That being said, their margins have increased, their dividends have increased, and insiders are buying the stock up. With all of this happening I think the stock is a 🟢Buy Opportunity🟢.
Let’s take a look at the other executive trades:

You can join the +100 others who have seen our returns go from 0 to this…

[FREE EDITION]
For the first time ever, today’s newsletter is FREE for all subscribers. If you are a paying subscriber you will have exclusive access to all this content from here on out.
To free subscribers: today is the last day to become a paying subscriber to enter the $2,000 December giveaway! Go paid to get access to all of the exclusive — MARKET BEATING — content below.
Next Week’s Playbook: Key Opportunities and Insights
The TLDR Summary
You pay for my research, my time, and most of all the saving of your time. That’s why we have a summary of everything below right here:
🟢The Buys:
GSK — Politician Trades
MYE — Executive Trades
MPWR — Top Investment Ideas
REGN — Top Investment Ideas
INFY — Top Investment Ideas
ASR — Top Investment Ideas
🟡The Watch (Stocks I like but not enough conviction to label as a buy)
None this week.
🤝Mergers & Acquisitions🤝
As the year comes to an end, deals have slowed. There was a lot of international news this week, but not a lot worth mentioning.
Other Interesting News
PR Firm FGS Rejigs Management Structure as KKR Seals Deal KKR 0.00%↑
Woodside to bring in several partners to Louisiana LNG project by March WDS 0.00%↑
🌟Top Investment Ideas🌟
This week I am looking for companies with the following characteristics:
Good Financial Strength
Good Operating Margin
Highly Profitability
Good EPS Growth over 5 years
Good Revenue Per Share Growth over 5 yearsThe cherry on top?
My models point to these stocks being undervalued in the short-term meaning they are ripe for a weekly price boost!
🟢 Infosys Ltd (INFY) 🟢
Current Price: $22.07
PE Ratio (TTM): 28.57
Operating Margin: 20.79%
Years of Profitability (Past 10 Years): 10
5-Year Revenue Growth Rate (Per Share): 15.50%
5-Year EPS without NRI Growth Rate: 12.40%
Technical Indicators:
RSI: 14-day RSI at 48.57, indicating neutral momentum.
Momentum: 12-1 Month Momentum at +23.55%, showing strong upward movement.
MACD: MACD has crossed above the signal line, suggesting bullish momentum.
Recent News: Infosys shares rose by 3.75% on November 22, outperforming the market.
Conclusion: Buy Opportunity this week as positive momentum and recent outperformance indicate potential for further gains.
🟢 Regeneron Pharmaceuticals Inc (REGN) 🟢
Current Price: $750.22
PE Ratio (TTM): 18.57
Operating Margin: 29.54%
Years of Profitability (Past 10 Years): 10
5-Year Revenue Growth Rate (Per Share): 23.10%
5-Year EPS without NRI Growth Rate: 19%
Technical Indicators:
RSI: 14-day RSI at 21.67, indicating oversold conditions.
Momentum: 12-1 Month Momentum at +14.68%, showing positive movement.
MACD: MACD is below the signal line, but approaching a potential crossover.
Recent News: No significant news in the past week.
Conclusion: Buy Opportunity this week as oversold RSI and positive long-term momentum suggest a potential rebound.
🟢 Monolithic Power Systems Inc (MPWR) 🟢
Current Price: $567.64
PE Ratio (TTM): 64
Operating Margin: 23.81%
Years of Profitability (Past 10 Years): 10
5-Year Revenue Growth Rate (Per Share): 27.80%
5-Year EPS without NRI Growth Rate: 42.30%
Technical Indicators:
RSI: 14-day RSI at 28.91, indicating oversold conditions.
Momentum: 12-1 Month Momentum at +68.92%, showing strong upward movement.
MACD: MACD has crossed above the signal line, indicating bullish momentum.
Recent News: No significant news in the past week.
Conclusion: Buy Opportunity this week as strong growth metrics and bullish technical indicators support potential gains.
🟢 Grupo Aeroportuario del Sureste SAB de CV (ASR) 🟢
Current Price: $260.14
PE Ratio (TTM): 17.21
Operating Margin: 56.54%
Years of Profitability (Past 10 Years): 10
5-Year Revenue Growth Rate (Per Share): 12.80%
5-Year EPS without NRI Growth Rate: 21.90%
Technical Indicators:
RSI: 14-day RSI at 42.11, indicating neutral momentum.
Momentum: 12-1 Month Momentum at +21.32%, showing positive movement.
MACD: MACD has crossed above the signal line, suggesting bullish momentum.
Recent News: Relative Strength Rating increased to 72, indicating improving performance.
Conclusion: Buy Opportunity this week as strong operating margins and improving technical indicators point to potential upside.
These analyses are based on current technical indicators and recent news. Consider your investment objectives and risk tolerance before making investment decisions. 🟢

📚Contrarian Trades📚
Alright, let’s talk about our two current contrarian trades, it isn’t looking great for them both right now.
HIMS Growth
Hims & Hers Health, Inc. (HIMS) has surged to new highs amid growing speculation surrounding potential changes in FDA leadership, which could emphasize digital health and patient-centric solutions. This aligns closely with HIMS' core strategy of leveraging telehealth and direct-to-consumer healthcare services. Investors are optimistic that regulatory reforms may create favorable conditions for digital health innovators, driving short-term volatility and long-term growth opportunities. While the rally reflects strong market enthusiasm, it is driven by speculation, so investors should remain cautious and focus on HIMS' underlying fundamentals as the broader healthcare landscape evolves.
Outlook:
In the near term, continued speculation around FDA leadership may fuel further volatility as the market reacts to potential policy changes. Over the long term, HIMS is well-positioned to benefit from the growing adoption of digital healthcare solutions and favorable regulatory shifts, making it a compelling stock to watch in the healthcare innovation space.
Currently, the HIMS trade is up around 94%.
SMRs, Data Centers, and Energy
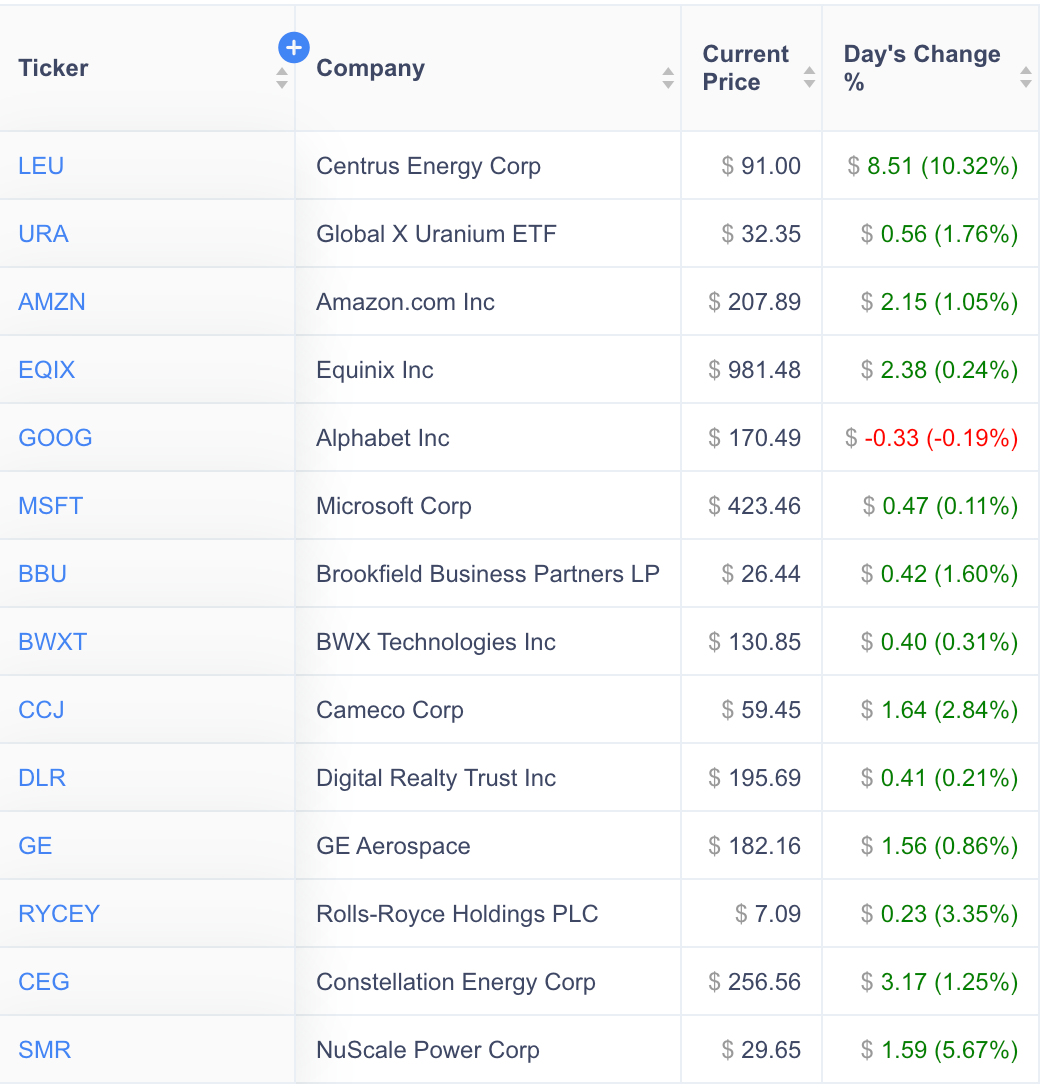
Since initiating the SMR/AI contrarian bet on November 13, 2024, the portfolio has delivered an impressive 5.68% total return, outperforming the broader S&P 500 (+0.79%) and Dow 30 (+2.17%), while significantly outpacing the NASDAQ 100 (-0.50%). The standout performers within the portfolio include Centrus Energy Corp (LEU), up 10.32%, reflecting growing market interest in nuclear energy as a vital component of sustainable energy solutions. Constellation Energy Corp (CEG) and NuScale Power Corp (SMR) also contributed positively, with gains of 1.25% and 5.67%, respectively, as investors increasingly recognize the role of SMRs in addressing the high energy demands driven by AI expansion.
Stocks like Amazon (AMZN) and Microsoft (MSFT) have seen modest but steady gains, signaling optimism about their long-term position in AI infrastructure. Meanwhile, Rolls-Royce Holdings (RYCEY) and Digital Realty Trust (DLR) are reflecting the importance of hybrid solutions, such as data center resilience paired with advanced energy technologies, in the AI-driven economy.
Forward Outlook:
Looking ahead, the narrative around SMRs and AI remains compelling. With the increasing energy demands of AI and the push for cleaner energy sources, companies in the nuclear and digital infrastructure space are poised for further growth. Regulatory support for SMRs and ongoing advancements in AI hardware infrastructure could act as catalysts for continued upside in names like LEU, CEG, and SMR. Furthermore, established tech giants like MSFT and GOOG are expected to maintain leadership in AI innovation, driving stable, incremental gains.
This portfolio remains a strong contrarian bet, positioned to capitalize on the intersection of clean energy adoption and AI growth, making it a compelling hold for the near term with substantial long-term potential.
Currently, the SMR trades are up 5.68% since 11/13/2024 vs the SPY at 0.79%

💼Flagship Portfolio💼
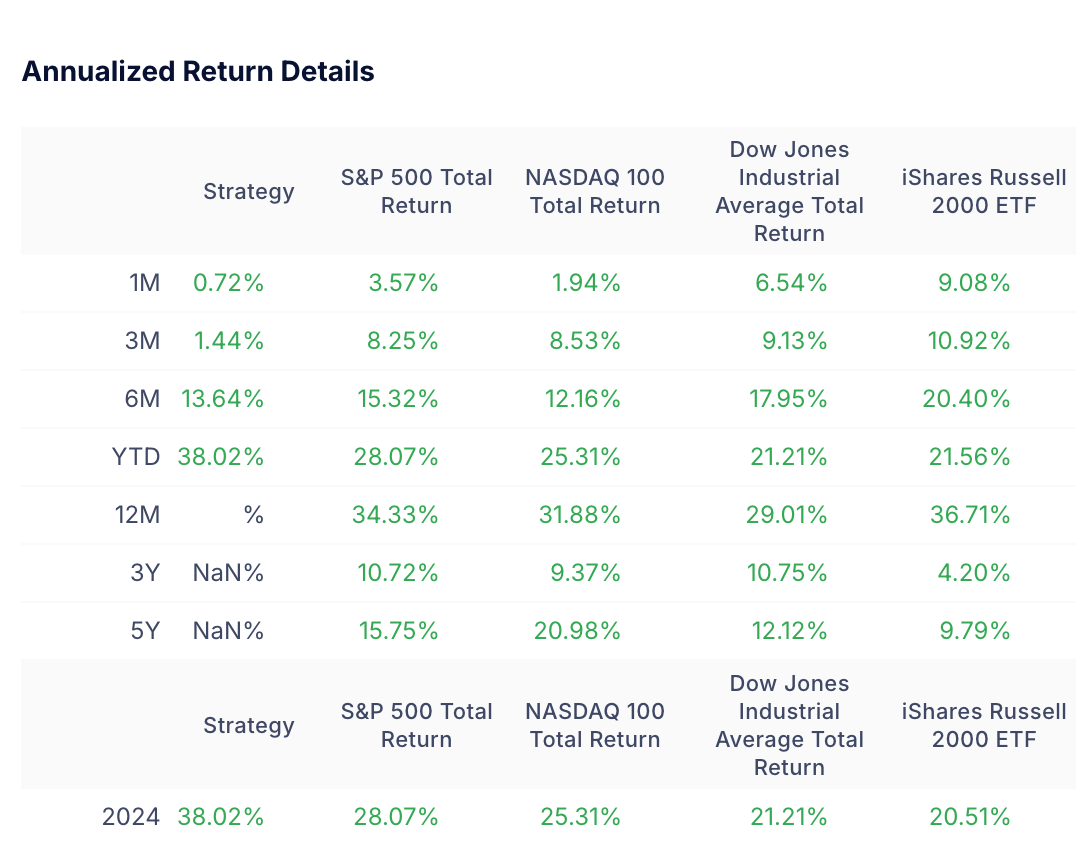
The flagship portfolio has delivered an impressive 38.02% YTD return, outperforming the S&P 500 (28.07%), NASDAQ 100 (25.31%), and other major indexes. Top performers include NVIDIA (NVDA) and ASML Holding (ASML), reflecting strong momentum in AI hardware and semiconductor innovation. Meta Platforms (META) and Arista Networks (ANET) also contributed significantly, driven by trends in digital advertising and networking.
While minor dips in Paycom (PAYC) and Regeneron (REGN) were noted, the portfolio remains robust.
Outlook:
With accelerating AI and semiconductor demand, key holdings like NVIDIA and ASML are positioned for sustained growth. Upcoming earnings and macroeconomic clarity could further bolster returns, making this portfolio a strong strategy for continued outperformance in 2024.
You can find the current flagship holdings here:

Currently, The Flagship Portfolio is up 38.02% YTD vs SPY returns at 28.07%

🔎Micro-Cap Finds🔎
These are stocks with market caps from $5 million — $50 million and offer the highest risk, highest reward scenarios in the stock market. These were requested by a paying subscriber and have been added for that reason!
Selected Top 3 Micro-Cap Stocks:
FMHS - Farmhouse Inc
BIOR - Biora Therapeutics Inc
VISL - Vislink Technologies Inc
1. Farmhouse Inc (FMHS)
Current Price: $0.22
Day's Change: 0%
5-Day RSI: 99.46 (indicating overbought conditions but showing strong momentum)
1-Year Volatility: 568.90%
1-Year Sharpe Ratio: 1.08
1-Year Sortino Ratio: 6.83
Momentum: Positive 12-month momentum at +337.50%.
Why Buy:
High Momentum: Positive price momentum suggests strong investor interest.
Low Price: At $0.22, the stock is accessible for speculative investment.
Sharpe and Sortino Ratios: Indicate favorable risk-adjusted returns, with a Sortino ratio particularly high.
Why Not Buy:
Overbought RSI: The RSI is extremely high, suggesting the stock might be overvalued in the short term.
High Volatility: Significant price swings could deter risk-averse investors.
Final Analysis:
Farmhouse Inc demonstrates strong speculative potential, especially for momentum traders. However, the high RSI warrants caution, as a correction may follow.
2. Biora Therapeutics Inc (BIOR)
Current Price: $1.95
Day's Change: +1.04%
5-Day RSI: 55.34
Momentum: Improving short-term momentum (-48.53% to -40.32%) suggests stabilization.
1-Year Volatility: 84.86%
Why Buy:
Stabilizing RSI: Mid-range RSI values indicate the potential for continued upward momentum.
Moderate Price: At $1.95, the stock provides room for growth without excessive risk.
Medical Sector: Operating in a resilient sector that benefits from consistent demand.
Why Not Buy:
Negative Momentum: Historical momentum remains negative, indicating past underperformance.
Volatility: High price swings may lead to unexpected losses.
Final Analysis:
Biora Therapeutics appears poised for recovery, supported by stabilizing RSI and momentum trends. It’s a promising option for investors seeking moderate-risk exposure to the medical sector.
3. Vislink Technologies Inc (VISL)
Current Price: $4.52
Day's Change: +4.87%
5-Day RSI: 46.04 (indicating neutral conditions with room for growth)
Momentum: Positive 12-month momentum at +66.67%.
Sharpe Ratio: 1.11 (suggesting good risk-adjusted returns).
Why Buy:
Positive Momentum: Outperformance over the past year makes it a growth candidate.
Resilient RSI: Neutral RSI suggests potential for upward movement without being overbought.
Sector Potential: Vislink operates in technology, a sector with strong long-term growth trends.
Why Not Buy:
Price Levels: At $4.52, the stock may be considered pricey relative to other micro-caps.
Volatility: Notable price volatility could deter conservative investors.
Final Analysis:
Vislink Technologies balances growth potential with manageable risk, making it an appealing option for those looking to diversify their portfolios with tech exposure.
Overall Recommendation:
Farmhouse Inc (FMHS): High-risk, high-reward speculative play for momentum-focused investors.
Biora Therapeutics Inc (BIOR): A more stable choice with recovery potential in the medical sector.
Vislink Technologies Inc (VISL): A balanced growth option in the technology space, suitable for long-term investors.
Suggested Allocation:
FMHS: 30%
BIOR: 40%
VISL: 30%
This allocation allows for a mix of speculative growth (FMHS), sector resilience (BIOR), and balanced exposure to technology (VISL).
📊Implied Options Price Movements📊
We look at trading options on these stocks with expiration dates on the day of the week we expect the movement to happen. We look at buying at-the-money calls or puts depending on how we think the company will perform.
If you own these stocks, look at trading covered calls on stocks you think will perform poorly.
This list is in order from Monday to Friday.
Monday (12/02): Credo Technology Group Holding Ltd (CRDO)
Expected Price Movement: ~20%
Sentiment: Bullish
Analysis: Credo Technology benefits from growing demand in AI-driven high-speed connectivity solutions. The company’s strong year-to-date performance and raised price targets from analysts suggest confidence in continued growth. Positive trends in data infrastructure support this outlook.
Tuesday (12/03): Pure Storage, Inc. (PSTG)
Expected Price Movement: ~12%
Sentiment: Bullish
Analysis: Pure Storage is positioned to capitalize on increasing enterprise IT demand for innovative storage solutions. With a strong focus on flash storage technology and cloud partnerships, the company is expected to see growth in revenue and market share.
Wednesday (12/04): Chewy, Inc. (CHWY)
Expected Price Movement: ~15%
Sentiment: Bearish
Analysis: Chewy faces competitive pressures in the e-commerce space and potential challenges with logistics and supply chains. While pet industry growth supports a baseline demand, the lack of significant recent catalysts suggests limited near-term upside.
Thursday (12/05): ChargePoint Holdings, Inc. (CHPT)
Expected Price Movement: ~20%
Sentiment: Bearish
Analysis: ChargePoint’s declining share price and heavy competition in the EV charging space raise concerns. Although long-term growth in EV adoption remains a positive factor, short-term risks include infrastructure expansion costs and slow profitability.
Friday (12/06): Toronto-Dominion Bank (TD)
Expected Price Movement: ~5%
Sentiment: Bullish
Analysis: Toronto-Dominion Bank’s strategic focus on digital innovation and acquisitions positions it well for steady growth. Its financial stability and consistent earnings make it a reliable investment in the banking sector, even amid macroeconomic challenges.
Summary:
Bullish Stocks: CRDO, PSTG, TD
Bearish Stocks: CHWY, CHPT
These sentiment analyses are based on current news, financial trends, and sector outlooks. Let me know if you need further insights!
- ¢, Founder of The Simple Side


Share this post