No Investment Advice or Brokerage; Disclaimer. For the avoidance of doubt, The Simple Side does not provide investment, tax, or legal advice. The value of any asset class can go up or down and there can be a substantial risk that you lose money buying, selling, holding, or investing in any asset. You should carefully consider whether trading or holding assets is suitable for you in light of your financial condition.
If this is your first time here, welcome! If you’re one of the nearly 300,000 returning subscribers, welcome back — we are glad to have you all!
Before we get into today’s newsletter I want to hear from you… yes you! Every newsletter I send has this quick survey you can use to request changes to the newsletter. Fill it out!
The only requests we had last week that are worth addressing in the newsletter were about joining the newsletter. I had people asking about the paid and lifetime subscriptions.
You can join our paid newsletter for $20 a month or $200 annually — now this price will be increasing soon, if you want to be grandfathered in at the current pricing join through this link: https://thesimpleside.substack.com/subscribe or the following button.
There is also one final slot available on our lifetime subscription at $1,000. Once this subscription is purchased, we will reset the lifetime subscription cost to $2,000. You can purchase the last ever $1,000 slot using this link Subscription Link or the button below!
PAID ACCESS ONLY — Thank you for all your support!
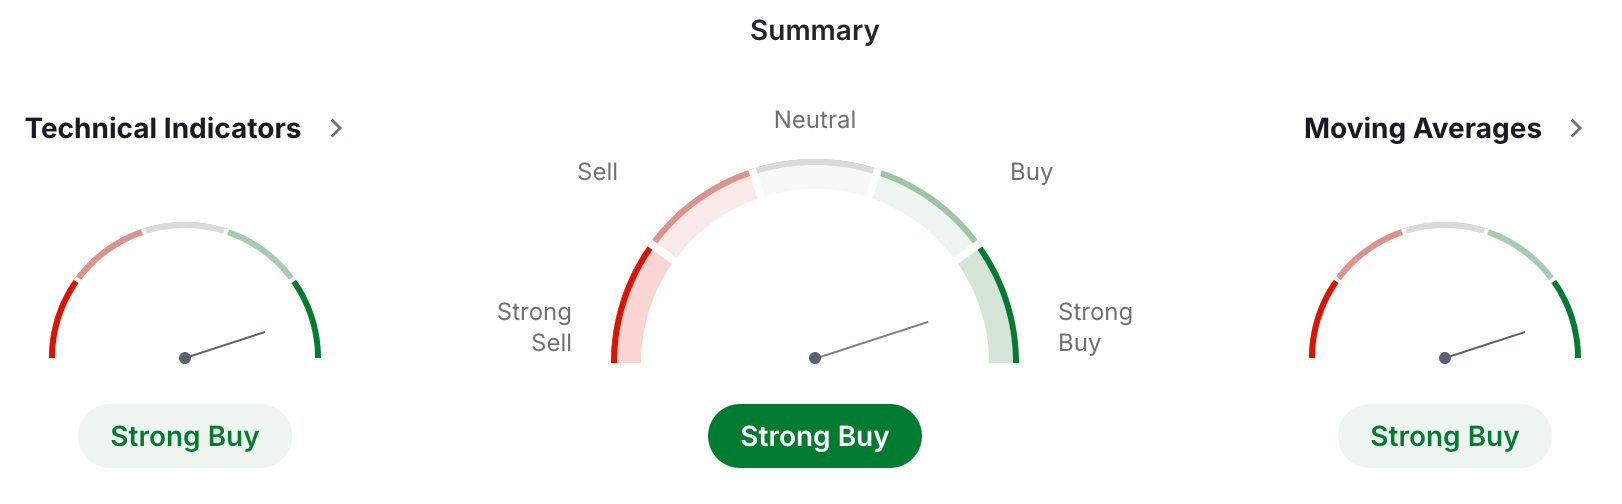
Stock Buy Summary
Mergers & Acquisitions Stocks
Top Stock Investment Ideas
Micro Cap Stock Picks
Earnings & Options
Updates & Developments
Current Developments
Copy Trading (EMAIL COMING MONDAY)
Paying subscribers will get an email this week on this topic — I am hoping to get everyone on the platform before the end of March!
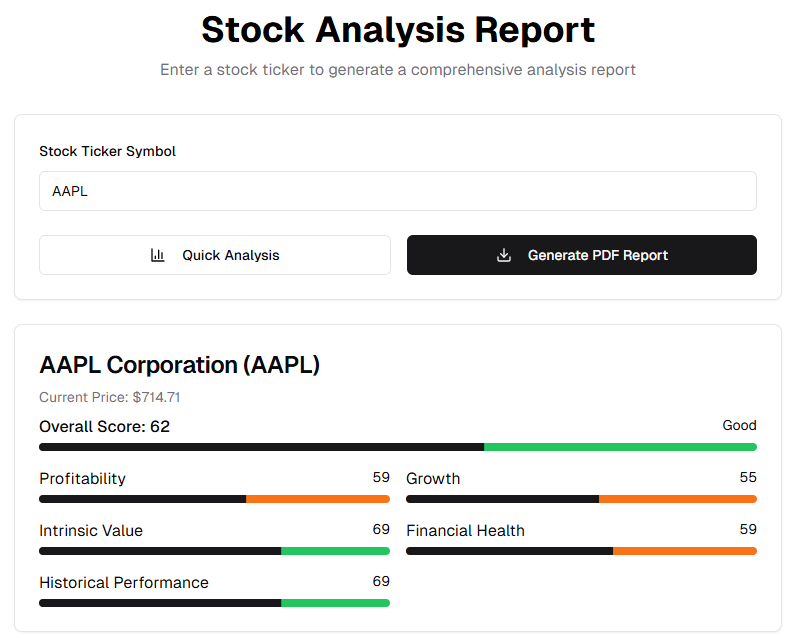
Stock/ ETF Scanner
I am close to finalizing development on this and then it will be opened up for paying subscriber use — see an example of what is in store below. This proprietary information costs over $100 per report from companies like “The Motley Fool.” Paying subscribers have UNLIMITED access (get in now before that price hike)!
Simple Side “Educational” Newsletters
We released an educational newsletter this week and it was very well received! There will be more to come!
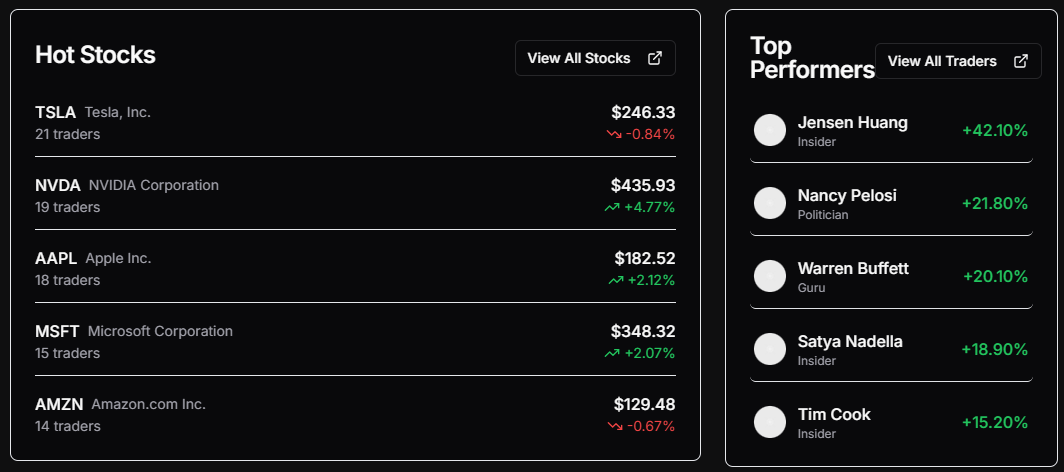
Our Website that tracks politician and insiders is being revamped and updated, so don’t worry if things don’t work properly right now! See below for what this looks like currently. Paying subscribers will also have unlimited access to this incredibly hard to obtain information!
Updates
Insider trading section of the newsletter now includes some stats about how the insiders trades typically perform.
Last year, we gave away over $4,000 to subscribers. Next month we will be giving away $2,000 worth of Apple Stock to one lucky winner!
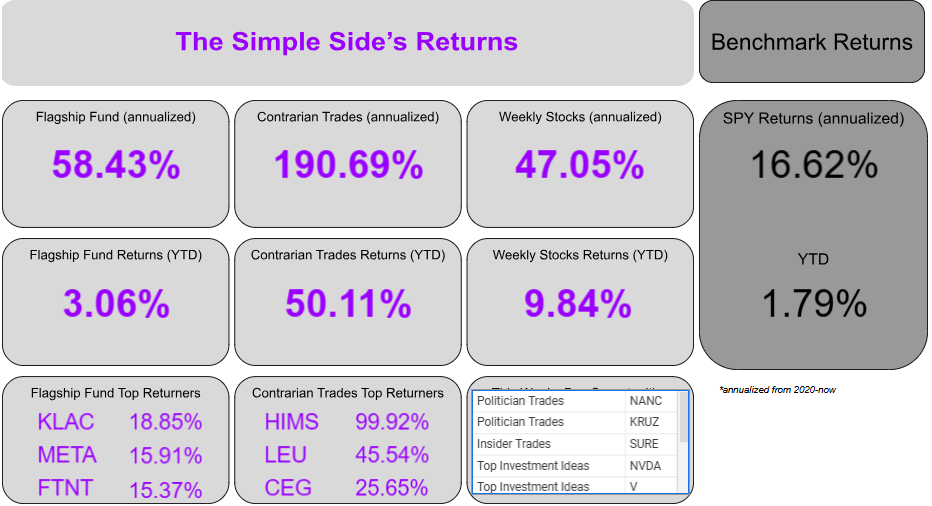
Reminder: paying subscribers have access this spreadsheet with all of our trades and their returns.
Here is what the dashboard looks like!
Weekly Trades Performance
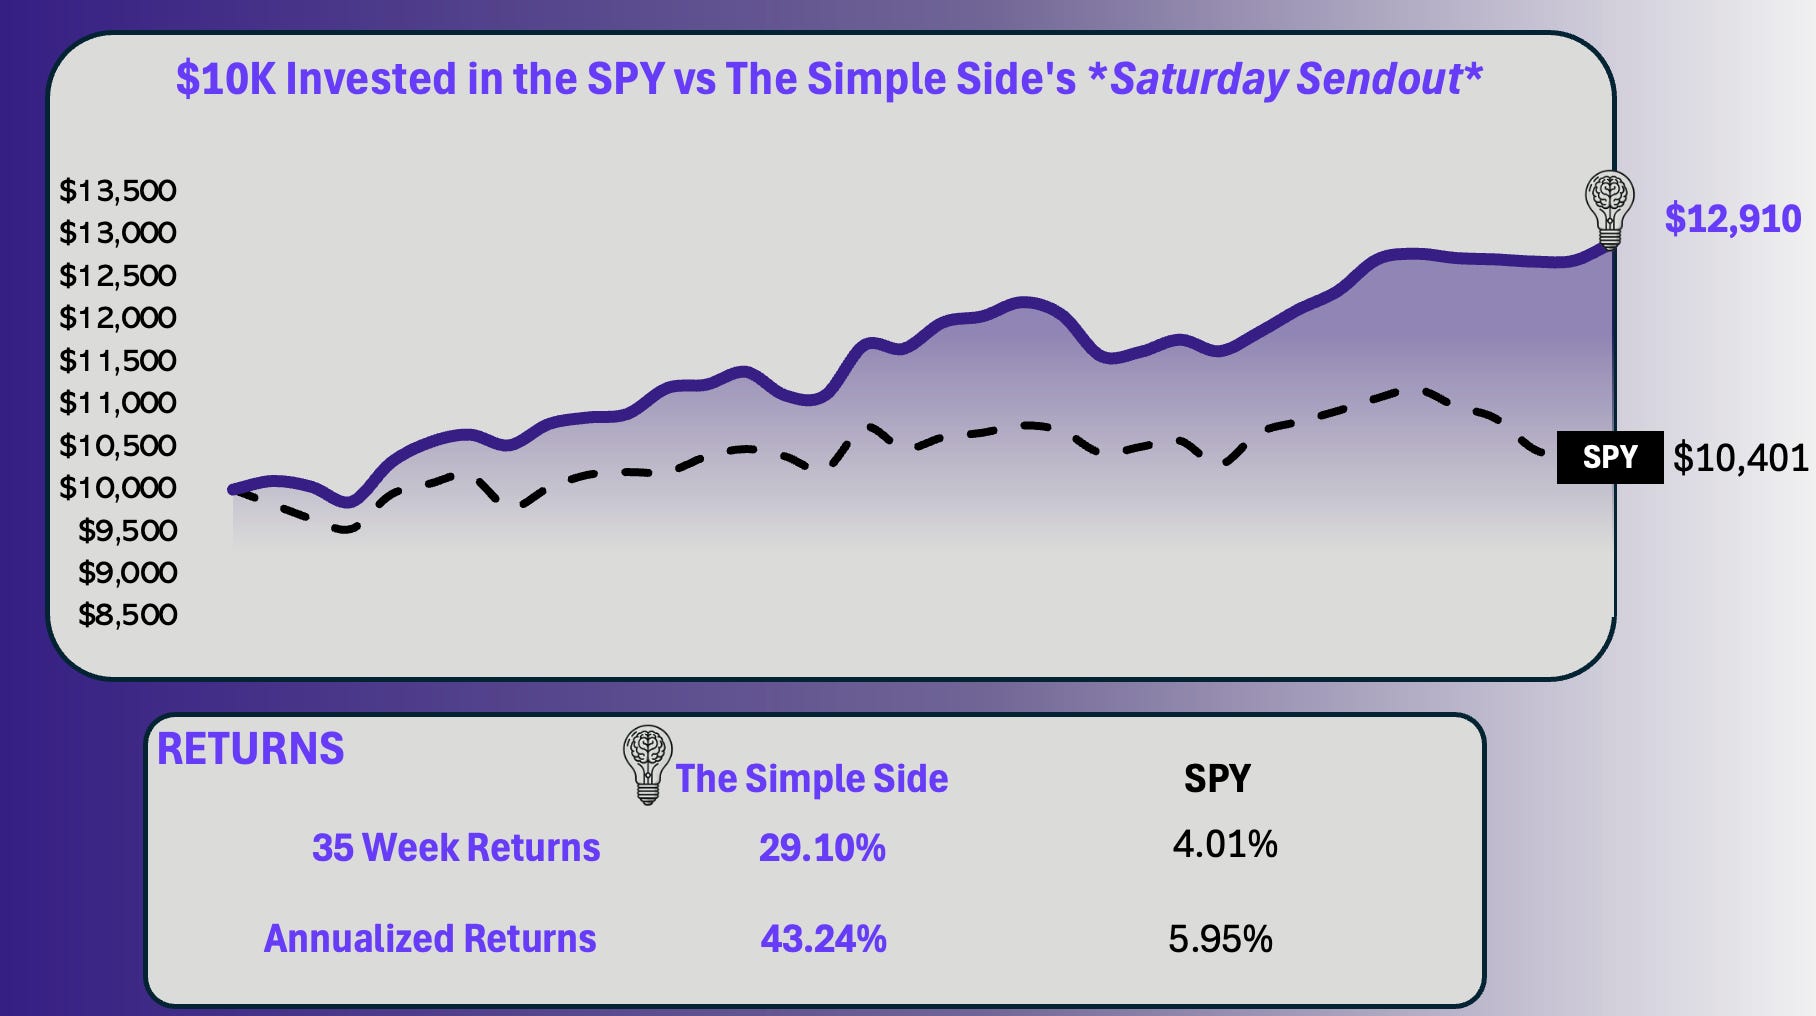
This section of the newsletter tracks the past performance of this weekly newsletter. As you will see, on average we have outperformed the S&P 500 from Monday to Friday, market open to market close.
The graph shows the growth of a $10K investment which began on July 20, 2024. You can find every newsletter dating back to July 20th here by CLICKING HERE.
Here are the current performance metrics:
If you haven’t joined already, you can click this button below to join the paid newsletter and get these weekly picks sent to your inbox every Saturday!
Currently, the projected YTD market returns are 0.9% — a slight decrease from last week’s 1%. This week in the markets we saw…
- 5437 stocks with gains in the market - 4086 stocks with losses in the market - The median return was +0.67%
The gains show a relative momentum swing upwards in the markets, but the question of sustainment remains — Will the market continue up or stay low? The bad news is that there still seems to be no turning around from the current negative directional shift. We will likely see next week open lower.
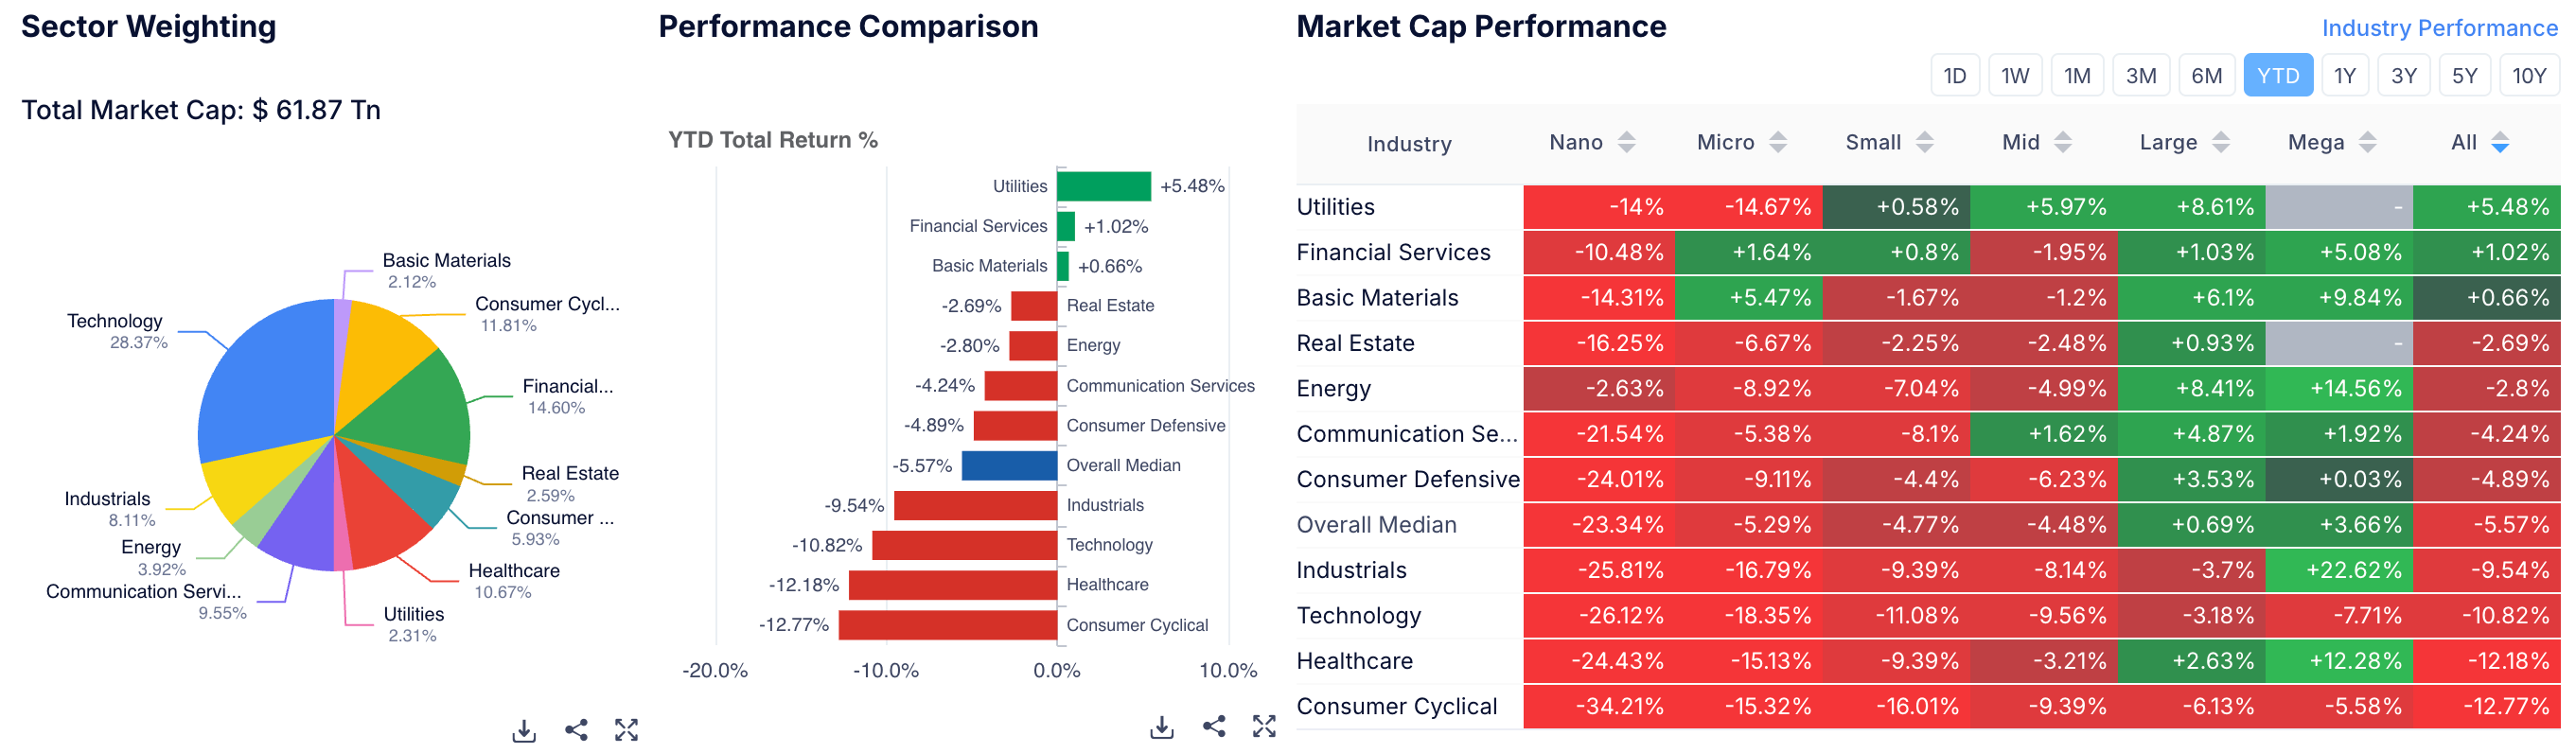
Sector Analysis
Top 3 Weekly Performers
- Energy: +2.64% — Last week was also the best performer! - Communication Services : +1.62% — Last week was a bottom 3 loser! - Technology: +1.01%
Bottom 3 Performers
- Utilities: -0.14% - Real Estate: -0.17% - Consumer Defensive: -3.57% — Last week was a bottom 3 loser!
Mohnish Pabrai (the “Warren Buffett” of India) believes that investing in what is “Hated and unloved” is the best road to success. So, if you’re looking for sectors that investors currently hate, look at the following sectors. These have underperformed the market YTD and over the past month:
Healthcare — avg YTD down 12.23% Consumer Cyclical — avg YTD down 12.52% Technology — avg YTD down 10.80%
Commentary: Buffet Sells Entire Stake In VOO
Over 3 weeks ago I began this commentary with the statement that the market is not showing signs of reversing the slowdown — look where we are now (continuing down).
Overall, this week the SPY eked out a 0.23% return… nothing compared to the -6% the market has returned over the past month.
Now, that information pales in comparison to what Buffet did on Friday. He sold his entire stake in VOO — what some consider to to be the best S&P 500 ETF on the market.
What has grabbed my attention, however, isn’t the fact that he sold. In fact, he has been “risk-off” meaning he doesn’t see value in the market right now, and has been for some time. What surprised me is how few people are talking about his massive sell-off. One of the biggest and best investors in the world just sold his S&P 500 stake!! Why aren’t we all going crazy over this?
Fox News
Berkshire has grown its cash pile to over $334 billion dollars — nearly triple what it was in 2024. There is clearly a market mispricing that Buffet does not like and I feel the same.
The uncertainty of the tariff war has been driving investors wild, and many folks are becoming increasingly nervous about the speculative state that has been driving the markets for the past 3 years. I wrote about this in a post not too long ago stating my opinion on the current state of the market: you can read that post below.
You have heard me discuss how the market is currently over 100% overvalued based on GDP levels and historical market returns. Don’t expect things to turn around before the end of March…
What are investors, like yourself, supposed to do to protect their investments during this market selloffs? Well, let’s take a look at what the “inside” money in the market is betting on — it's time to discuss politician and insider trading!
Politician Trading Report
Politician trading matters… a lot. In 2024, the top-gaining politician was republican David Rouser who returned 104.1% — followed closely by democrat Pelosi who returned 70.9% over the year.
This report tracks the five most recent politician trades and two large holdings in my portfolio — ETFs NANC 0.00%↑ (which tracks democrat trading) and KRUZ 0.00%↑ (which tracks republican trading).
NANC was +0.14% on the week, -7.78% this past month, and -4.88% YTD. KRUZ was +1.31% on the week, -3.82% this past month, and -1.15% YTD. For comparison, the SPY year-to-date is -3.53%.
Over the past 30 days, 22politicians made 427 trades with a total trade volume of $9.03 million. The buy/sell ratio is now 3, down from 4.4 last week this still shows bullish sentiment, but it seems to be declining.
Here are the 5 most recent politician trades:
Insider Trading Report
This report tracks the five largest insider buys from the past week and a new ETF in my portfolio — ticker SURE — which tracks insider trading.
SURE is -0.51% this week, -4.51% this month, and -3.39% YTD.
The monthly buy/sell ratio is up to 0.31 — higher than last week’s 0.29 — but below the 5-year average of 0.35. This indicates a slightly bearish sentiment from insiders.
Here are the 5 largest trades from this past week:
Here are two interesting transactions from the report above.
Dustin A. Moskovitz
Average Return per transaction: -53.08%
Outperforming Transactions: 2% on 54 trades
ASAN History - 99.99% of current portfolio - 56 buys & 1 sells over 5 years
Dustin is the perfect representation of why following insiders selectively is important. While he may be buying close to the 52-week low, his trades typically underperform — copy trading here requires lots of research.
Broadwood Partners
Average Return per transaction : 23.29%
Outperforming Transactions: 52% on 75 trades
STAA History - 76% of current portfolio - 17 buys & 9 sells
STAA is at a 52-week low of $17.7 and has been experiencing large amounts of insider buying.
Our premium subscribers get access to long-term, mid-term, and short-term strategies that all beat the market. You can too, join now!
Technical Gold is currently trading near the pivotal $3,000 level, with the XAU/USD pair reading around $3,023.71. The intraday Pivot Point at $3,042 is the first resistance to clear, followed by a recent all-time high of $3,057 reached on Thursday and the R1 level at $3,059. Beyond that, R2 resistance comes in at $3,074.
On the downside, buyers have been active around the S1 support at $3,027, with further backing expected at S2 near $3,011 and the key psychological level at $3,000.
Fundamental The recent pullback in Gold is largely driven by a combination of a stronger US Dollar, ongoing profit-taking amid the quadruple witching event, and cautious market sentiment.
Quadruple witching, which sees the simultaneous expiration of various futures and options, has provided traders with an opportunity to secure gains, contributing to temporary volatility. Meanwhile, persistent geopolitical tensions in regions such as Gaza and Turkey, coupled with anticipated tariff commentary from President Trump, add to the uncertainty.
Despite these challenges, Gold's rally remains robust for the year, buoyed by safe-haven demand in an environment of escalating geopolitical risks.
Scenarios & Strategy If profit-taking abates and contract rollovers occur smoothly, Gold may resume its climb by clearing the $3,042 pivot and testing the resistance levels around $3,057 and $3,074. However, if the stronger Dollar and prevailing risk-on sentiment continue to pressure the market, a breach of the S1 support at $3,027 could lead to further corrections toward $3,011 or even the critical $3,000 level.
For traders, the key will be to monitor these support and resistance zones closely—buying on dips near these levels could offer attractive opportunities, while a decisive break below the support may signal additional downside risk.
For those short on time, here’s a snapshot of our latest article on covered calls and why they might be a smart addition to your retirement strategy:
How It Works: Covered calls involve selling a call option on a stock you already own. You agree to sell your shares at a predetermined strike price by a set date. In exchange, you receive a premium upfront, effectively “renting out” your stock.
Benefits: The primary perk is extra income—you pocket the premium regardless of whether the option is exercised. This strategy can provide a modest buffer against minor price drops and enhance overall returns, especially when done consistently.
Why It’s Good for Retirement: For long-term investors and retirement portfolios, covered calls can generate steady, predictable cash flow without requiring additional investment. They’re particularly attractive for those seeking supplemental income and a conservative way to boost yields on established holdings.
Downsides: The trade-off is that your upside is capped. If the stock surges past the strike price, you miss out on additional gains since you’re obligated to sell at the lower, agreed-upon price. Moreover, while the premium helps offset small losses, significant declines in the stock price can still hurt your portfolio.
How to Make Smart Trades: To maximize benefits, choose stable, blue-chip stocks with predictable price movements. Set strike prices that reflect your target sale levels, and select expiration dates that align with your income goals. Monitor market conditions and be prepared to adjust your strategy if a stock’s performance or volatility changes.
Enjoy these insights and consider how covered calls might add a little extra income and stability to your retirement planning!
Portfolio Updates
Copy Trading Emails will be sent to more paying subscribers this week! Be on the lookout for it!!
Flagship Fund Updates Our Flagship Fund is still outperforming the SPY so far this year. While not by the vast margins we have seen in the past, we are still happy with the outperformance.
As of now, we do not see a stock being cut in the near future. While some returns are subpar, nothing jumps out as “scary” or negative long-term. I have been looking at creating some more risk-adjusted portfolios for those looking to place their money in “safer” long-term bets while the market resets. Be on the lookout for announcements on The Simple Side 500 and The Simple Side 50 portfolios (available on our copy trading platform).
Second Hand AI Effects Portfolio Overall, this portfolio is up 46.94% YTD — which has been boosted by HIMS which we sold for 99% returns earlier this year. The other half of the portfolio is down 5% YTD and is focused on energy and data center stocks. While in the short term, there may be underperformance here, we expect that we will see outperformance over the next 5-10 years.
We will continue to adjust this portfolio based on market action as time goes on.
Weekly Trades With the market’s continual decline, our weekly trades have proven to be a success. The limited loss structure we have in place along with the ability to capture short-term rebounds has brought this portfolio up to 11% returns YTD.
It will remain a trader’s market until we see a reversal in current market downtrends.
Paying subscribers, all of your info and analysis is below! Enjoy and I will see you all next weekend. Look for educational emails, and copy trading announcements coming in this week.
If you want access to it all, join before prices soar (just like your account will with The Simple Side). JOIN HERE or click the buttons below.
This is where I bring you a curated list of stocks my model says offer the best upside with the least potential for loss this week. Of course, I will report on all of the stocks weekly, but that doesn’t mean you need to buy all of them or any of them every week. Do your own diligence, and you might just outperform me!
Listen to this episode with a 7-day free trial
Subscribe to The Simple Side to listen to this post and get 7 days of free access to the full post archives.
The Saturday Sendout is tradeable market news in one place. Get weekly financial information on insider, company executive, and politician trading plus tons of other insights.
The Saturday Sendout is tradeable market news in one place. Get weekly financial information on insider, company executive, and politician trading plus tons of other insights.