No Investment Advice or Brokerage; Disclaimer. For the avoidance of doubt, The Simple Side does not provide investment, tax, or legal advice. The value of any asset class can go up or down and there can be a substantial risk that you lose money buying, selling, holding, or investing in any asset. You should carefully consider whether trading or holding assets is suitable for you in light of your financial condition.
If this is your first time here, welcome! If you’re one of the nearly 300,000 returning subscribers, welcome back — we are glad to have you all!
Before we get into today’s newsletter I want to hear from you… yes you! Every newsletter I send has this quick survey you can use to request changes to the newsletter. Fill it out!
Reminder: paying subscribers have access this spreadsheet with all of our trades and their returns.
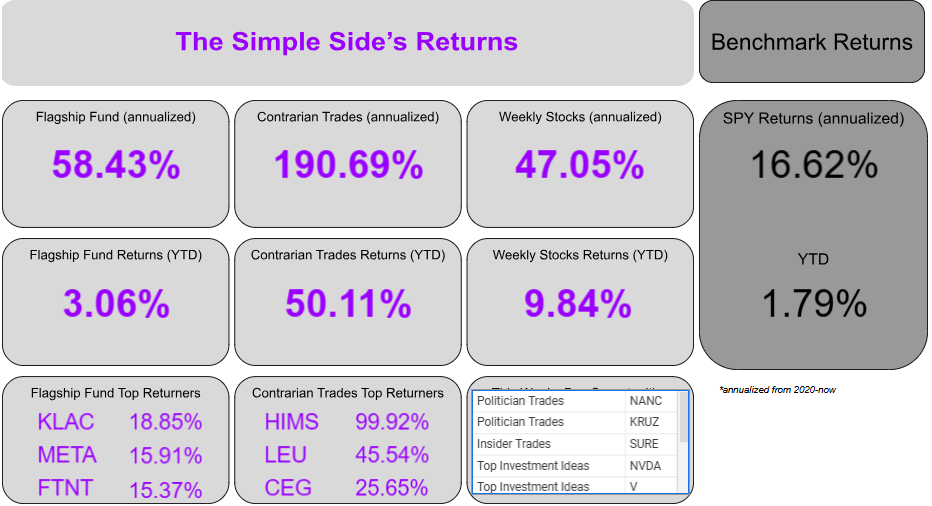
Here is what the dashboard looks like!
Weekly Trades Performance
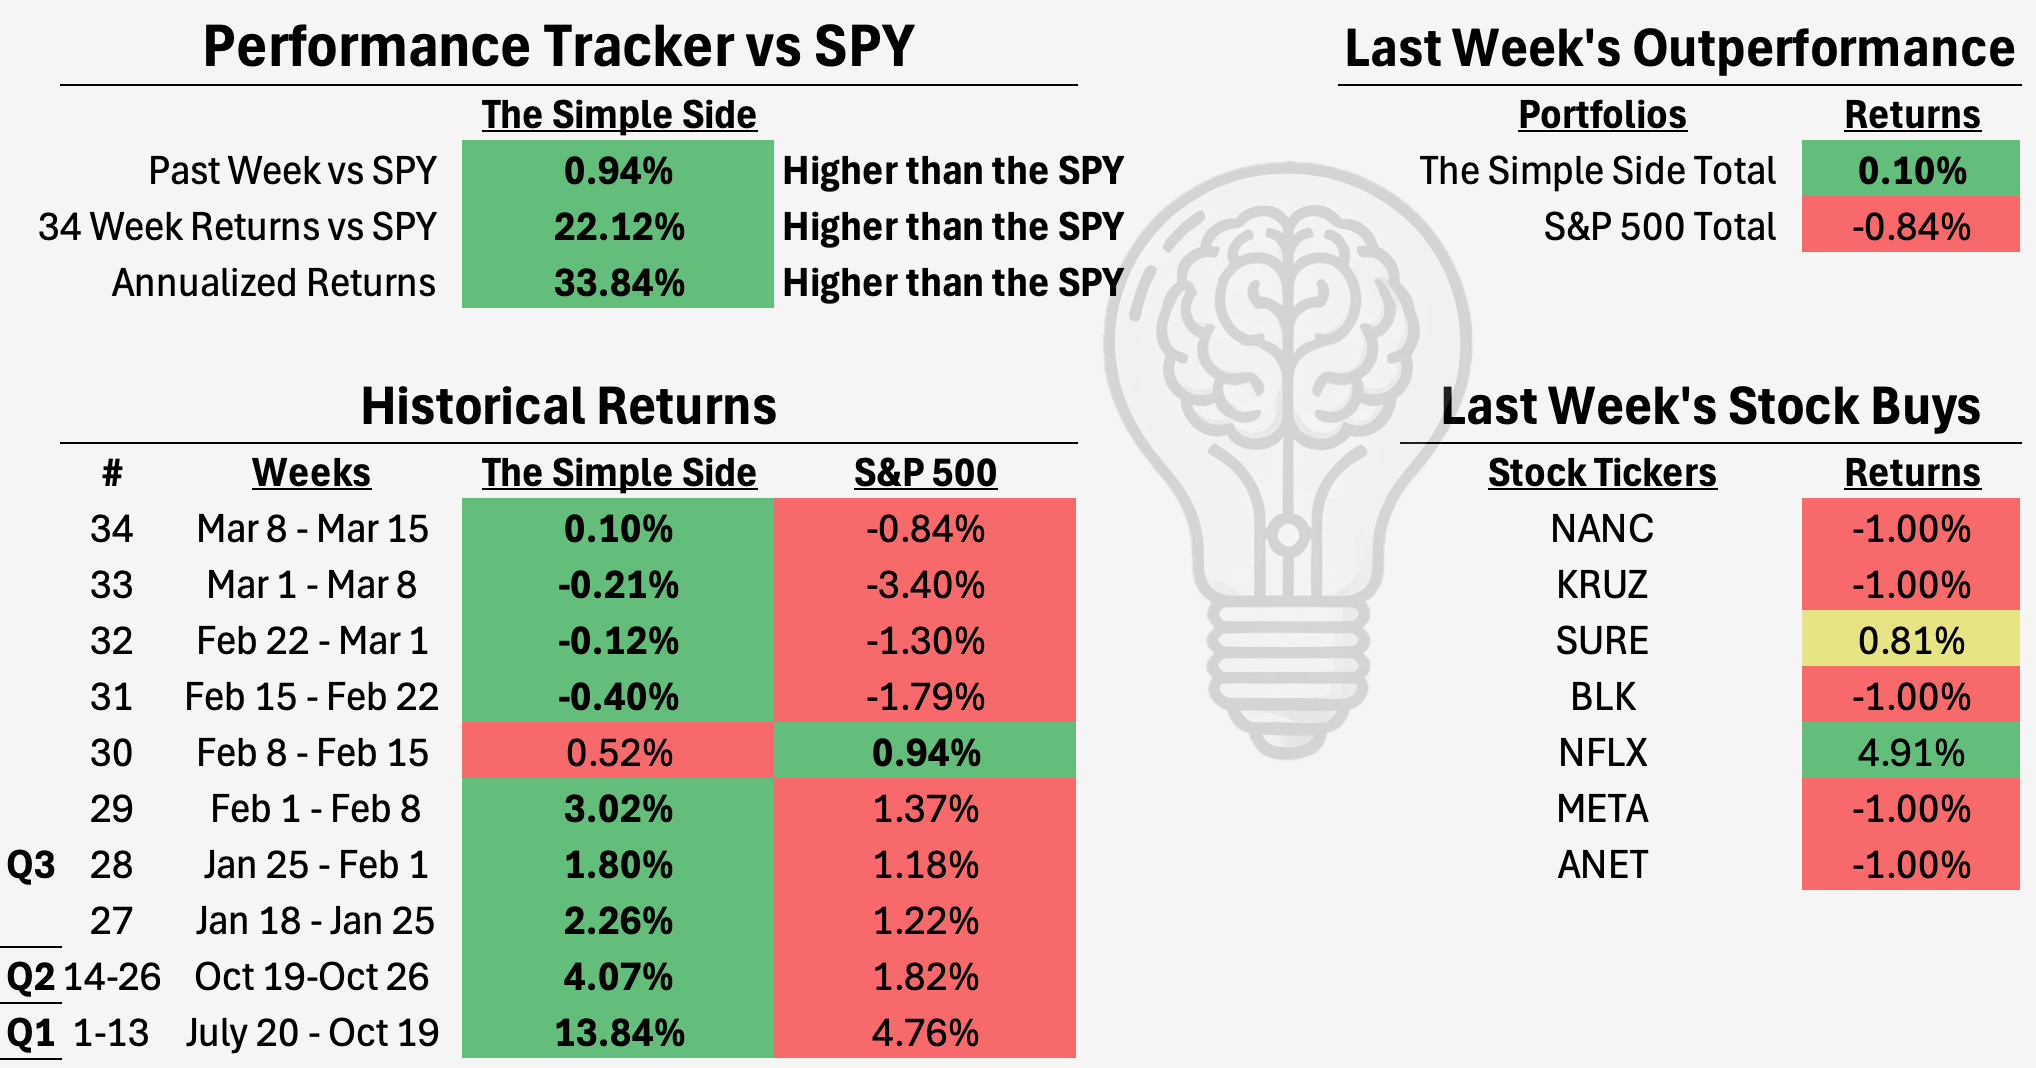
This section of the newsletter tracks the past performance of this weekly newsletter. As you will see, on average we have outperformed the S&P 500 from Monday to Friday, market open to market close.
The graph shows the growth of a $10K investment which began on July 20, 2024. You can find every newsletter dating back to July 20th here by CLICKING HERE.
Here are the current performance metrics:
If you haven’t joined already, you can click this button below to join the paid newsletter and get these weekly picks sent to your inbox every Saturday!
Mohnish Pabrai (the “Warren Buffett” of India) believes that investing in what is “Hated and unloved” is the best road to success. So, if you’re looking for sectors that investors currently hated, look at the following sectors. These have underperformed the market YTD and over the past month:
Industrials Communication Services Healthcare Consumer Cyclical Technology
Commentary
Overall, the market doesn’t show signs of slowing its descent into oblivion — well, maybe not oblivion — but that is what we said last week and it has proven to be true.
Trump’s tariff war has been an ongoing issue (though I believe it to be a big nothing-burger). In the long run, it will likely pan out to be beneficial for the country as we will have bargaining power with our allies and enemies alike. I can see conversations like “reduce our debt to you and we will reduce our tariffs” in our near future.
The only stock from the fabled FAANG that has managed to post gains YTD has been META with a mild 3.87% return.
We luckily structured our main portfolio “The Flagship Fund” to remain somewhat independent of the market by adding ZROZ stock earlier this year — ZROZ is a bond ETF. This move has proven beneficial and we expect it to continue to be so as the market continues down.
If we happen to see the FED show hawkish sentiment and rates drop this week, bond prices should rally and benefit the portfolio further. I am going to continue to DCA into the portfolios as time goes on!
I will also mention that I don’t think a road to recovery is currently in sight. If the market rebounds, it will likely be short term before another (and larger) drop.
Politician Trading Report
Politician trading matters… a lot. In 2024, the top-gaining politician was republican David Rouser who returned 104.1% — followed closely by democrat Pelosi who returned 70.9% over the year.
This report tracks the five most recent politician trades and two large holdings in my portfolio — ETFs NANC 0.00%↑ (which tracks democrat trading) and KRUZ 0.00%↑ (which tracks republican trading).
NANC was +0.53% on the week, -10.5% this past month, and -5.60% YTD. KRUZ was -0.36% on the week, -7.89% this past month, and -4.12% YTD. For comparison, the SPY year-to-date is -4.63%.
Over the past 30 days, 23politicians made 610 trades with a total trade volume of $27.22 million. The buy/sell ratio is now 4.4, which shows a bullish sentiment from politicians. THIS IS THE HIGHEST THE NUMBER HAS BEEN IN 5 YEARS.
Here are the 5 most recent politician trades:
Insider Trading Report
This report tracks the five largest insider buys from the past week and a new ETF in my portfolio — ticker SURE — which tracks insider trading.
SURE is +0.81% this week, -9.18% this month, and -7.00% YTD.
The monthly buy/sell ratio is up to 0.29 — higher than last week’s 0.24 — but is below the median of 0.28. This indicates a slightly bearish sentiment from insiders.
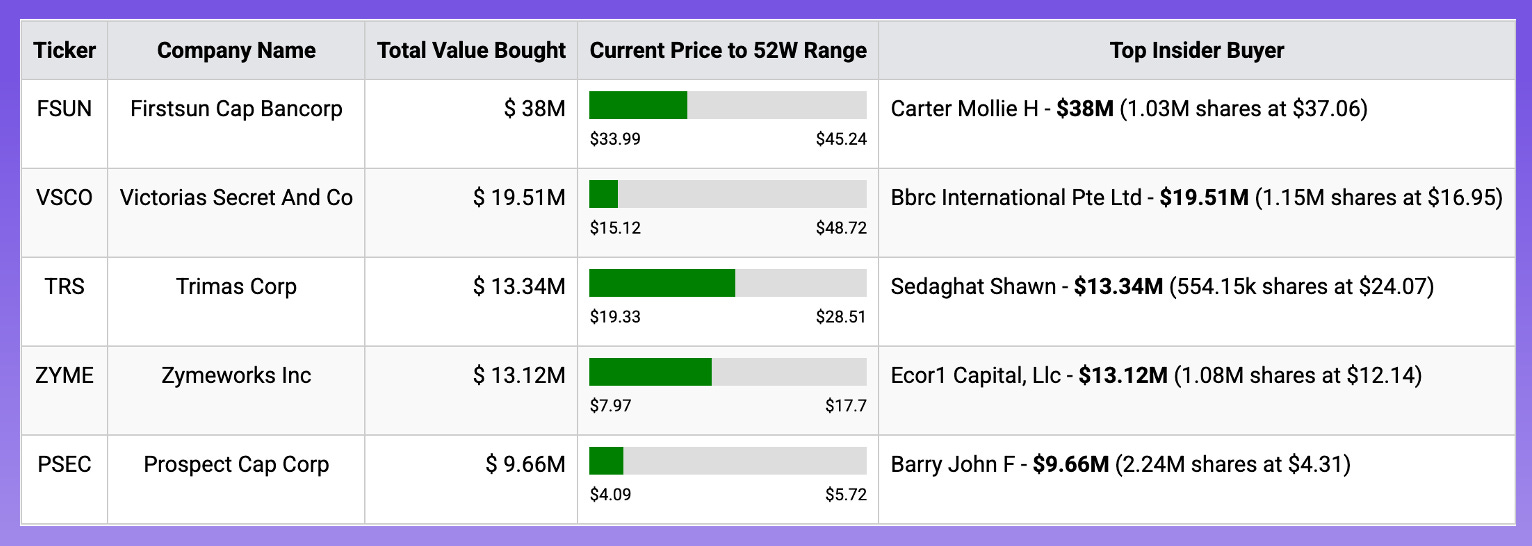
Here are the 5 largest trades from this past week:
Here are two interesting transactions from the report above.
Mollie H Carter
Average Return per transaction: 0.17%
Outperforming Transactions: 50% on 4 trades
FSUN History - 2.46% of current portfolio - 1 buys & 1 sells over 5 years
John F Barry
Average Return per transaction : 1.49%
Outperforming Transactions: 48% on 198 trades
PSEC History - 100% of current portfolio - 31 buys & 0 sells
Our premium subscribers get access to long-term, mid-term, and short-term strategies that all beat the market. You can too, join now!
Technical Gold briefly pierced the $3,000 threshold before slipping back to around $2,980 on Friday. Although bullish momentum persists, the pullback suggests rising US Treasury yields and risk-on flows are capping immediate upside.
Key intraday support appears near $2,970 (daily Pivot), backed by deeper levels at $2,951 (S1) and $2,914 (S2).
A climb back above $2,993 would target the psychological $3,000 mark, with $3,007 and $3,026 (R1/R2) as next milestones in uncharted territory.
Fundamental Tariff concerns resurfaced as President Trump threatened a 200% levy on select European goods, fueling safe-haven demand earlier in the week.
However, renewed optimism in equity markets and increased US yields triggered profit-taking in Gold. Meanwhile, expectations of no Fed rate changes at the March meeting continue to support the medium-term bullish narrative.
Chinese gold stocks’ strong performance highlights persistent demand for the precious metal, while analysts point out holdings remain below 2020 peaks, leaving room for further inflows.
Scenarios & Strategy If intensifying trade tensions undermine risk sentiment, Gold may reclaim $3,000 and head for fresh highs. Conversely, if bond yields rise further or equities extend their rally, Gold could slip toward $2,951–$2,914.
Near-term traders may look to buy on dips, watching for a bounce near $2,970 or $2,951. More cautious market participants might wait for a clear break above the $3,000 mark before positioning for additional upside.
Arch Capital Group is a Bermuda-based insurer offering a range of insurance, reinsurance, and mortgage insurance products worldwide. Analysts rate the stock highly, with some projecting $115 or more (vs. its current $90.10), while fair-value estimates run as high as $130–$150—highlighting the market’s view of Arch’s strong underwriting discipline and growth potential.
Under a Buffett-style, five-step framework, Arch passes nearly all key points:
Understandable Model (Pass): Despite its multiple lines, the core insurance “float” strategy and disciplined underwriting echo Berkshire Hathaway’s own approach.
Proven Earnings (Pass): Arch has expanded from about $3.6 billion in revenue a decade ago to over $16.9 billion in 2024, with ROE consistently in the double digits (near 21–22%).
Economic Moat (Pass): Its combination of specialty lines, mortgage insurance expertise, and strong underwriting record keeps returns on invested capital well above its cost of capital, suggesting a durable competitive edge.
Low Debt Growth (Pass): With a debt-to-equity ratio of just 0.13 and interest coverage over 30×, Arch carries leverage prudently.
Fair or Undervalued (Pass): Valuations like a PEG of ~0.37 and a deeply discounted DCF imply considerable upside potential, making ACGL appear attractively priced for value-minded investors.
Overall, Arch Capital’s disciplined, multi-line model—combined with strong financial metrics and favorable valuation—makes it a compelling candidate for a long-term Buffett-style portfolio.
Portfolio Updates:
Copy Trading Emails will be sent to more paying subscribers this week! Be on the lookout for it!!
Flagship Fund Updates Our Flagship Fund is still outperforming the SPY so far this year. While not by the vast margins we have seen in the past, we are still happy with the performance. We analyzed ACGL this week and are looking to add it as a new position in the portfolio. See the Berkshire buy newsletter for our view on the stock.
Second Hand AI Effects Portfolio Overall, this portfolio is up 96.16% YTD. We held HIMS during the beginning of the year and sold at 99% returns — hence why the portfolio has done so well. The other half of the portfolio is down 6% YTD, but we expect these stocks to start producing serious returns in 5 - 10 years. We are looking for new positions to open in this portfolio, but we don’t see any “sure bets” yet.
Weekly Trades Limiting our weekly trade losses to 1% has proved to be extremely beneficial. As you saw earlier, we have managed to return nearly 10% YTD while the S&P 500 lags at -4.51% returns. Overall, we are extremely happy with this performance.
Paying subscribers, all of your info and analysis is below! Enjoy and I will see you all next weekend. Look for educational emails, and copy trading announcements coming in this week.
The Saturday Sendout is tradeable market news in one place. Get weekly financial information on insider, company executive, and politician trading plus tons of other insights.
The Saturday Sendout is tradeable market news in one place. Get weekly financial information on insider, company executive, and politician trading plus tons of other insights.