


"The stock market is a device for transferring money from the impatient to the patient." — Warren Buffett

No Investment Advice or Brokerage; Disclaimer. For the avoidance of doubt, The Simple Side does not provide investment, tax, or legal advice. As with any asset, the value of any asset class can go up or down and there can be a substantial risk that you lose money buying, selling, holding, or investing in any asset. You should carefully consider whether trading or holding assets is suitable for you in light of your financial condition.
Happy Saturday, simple investor!
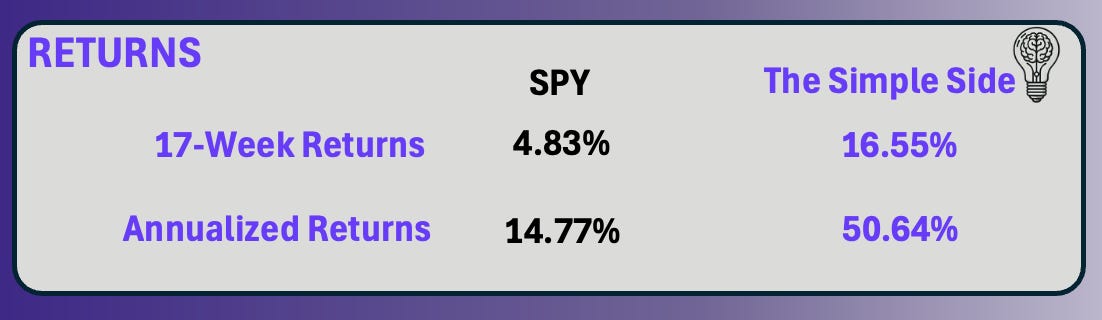
See below for some quick updates before we get into this week's returns — which outperformed the S&P 500 again!
Quick Updates
If you like quick, short-form stock updates and analysis daily, check out my daily newsletter (only costs $10 a year or $1 a month).
Paying subscribers have access to the $2,000 giveaway in December — these giveaways help me reduce my tax bill! See the most recent post I wrote about it all right here:
The homepage of my website has been rearranged. I am in the process of adding missing posts. I now have the following sections:
I will be doing a podcast Q&A to answer any and all questions that people have emailed to me or that they have sent to me with the button below!

Feel free to send me an email by replying to this message, or emailing my other email: thesimplesidenews@gmail.com.
You can also click the button below and let me know anonymously about anything!
Past Performance
QUICK PSA: Last week’s total performance was miscalculated. I had a formula in Excel where I tracked all the returns that were set up improperly and it changed my total return. The issue has since been corrected (thank you to Davide who reached out to me on this topic).
This section of the newsletter tracks the past performance of this weekly newsletter. As you will see, we have (on average) outperformed the S&P 500 from Monday to Friday, market open to market close. Take a look:
The graph shows the growth of a $10K investment which began on July 20, 2024.

These returns represent what I have returned since July 20 of this year when I started sending these weekly stock picks. So far, the SPY has been no match; however, I understand there will likely be a reversion to the mean for me eventually. That is why we have added the contrarian trades and the flagship portfolio updates (longer-term holds) to this newsletter for paying subscribers.
That being said, I will continue spending countless hours a week dedicated to finding the best stocks for your portfolio and mine!

You can find every newsletter dating back to July 20th here by CLICKING HERE.
If you want a quick summary of how everything has performed week to week check out this image!

If you are finding all of this valuable you can support me and my work by clicking that fancy button below!

Today’s Reporting Information
Quick Overview
Investing for Next Week (For Paying Subscribers)
Mergers and Acquisitions
Top Investment Ideas
Contrarian Bets
Flagship Portfolio Updates
Micro-Cap Picks *NEW*
Expected Stock Movements From Options Trading
Politician Trading Report & Politician ETFs
This report tracks the five most recent politician trades and two large holdings in my portfolio — ETFs NANC 0.00%↑ (which tracks democrat trading) and KRUZ 0.00%↑ (which tracks republican trading).
NANC is down 2.76% this week, up 2.72% this past month, and 28.80% YTD.
KRUZ is down 2.11% this week, up 0.97% this past month, and 17.80% YTD.
What’s fueled those sweet returns? Well, over the past 30 days, 17 politicians have made 216 trades investing over $3.69 million.
Politician Stock Highlight
I went ahead and combed through all of the recent trades and I noticed one trend over the past week or two: buys. They have been all over and most came from Marjorie Taylor Greene who seems to be extremely active in trading these days. In fact, she has bought over $3.25 million worth of stock this year alone.
There’s nothing specific she seems to be buying and nothing that catches my eye. Some of the industries she invested in include cybersecurity and energy companies. Maybe she knows about the data center and AI trades article we came out with last week.
Here are the most recent politician trades:

Insider Trading Report
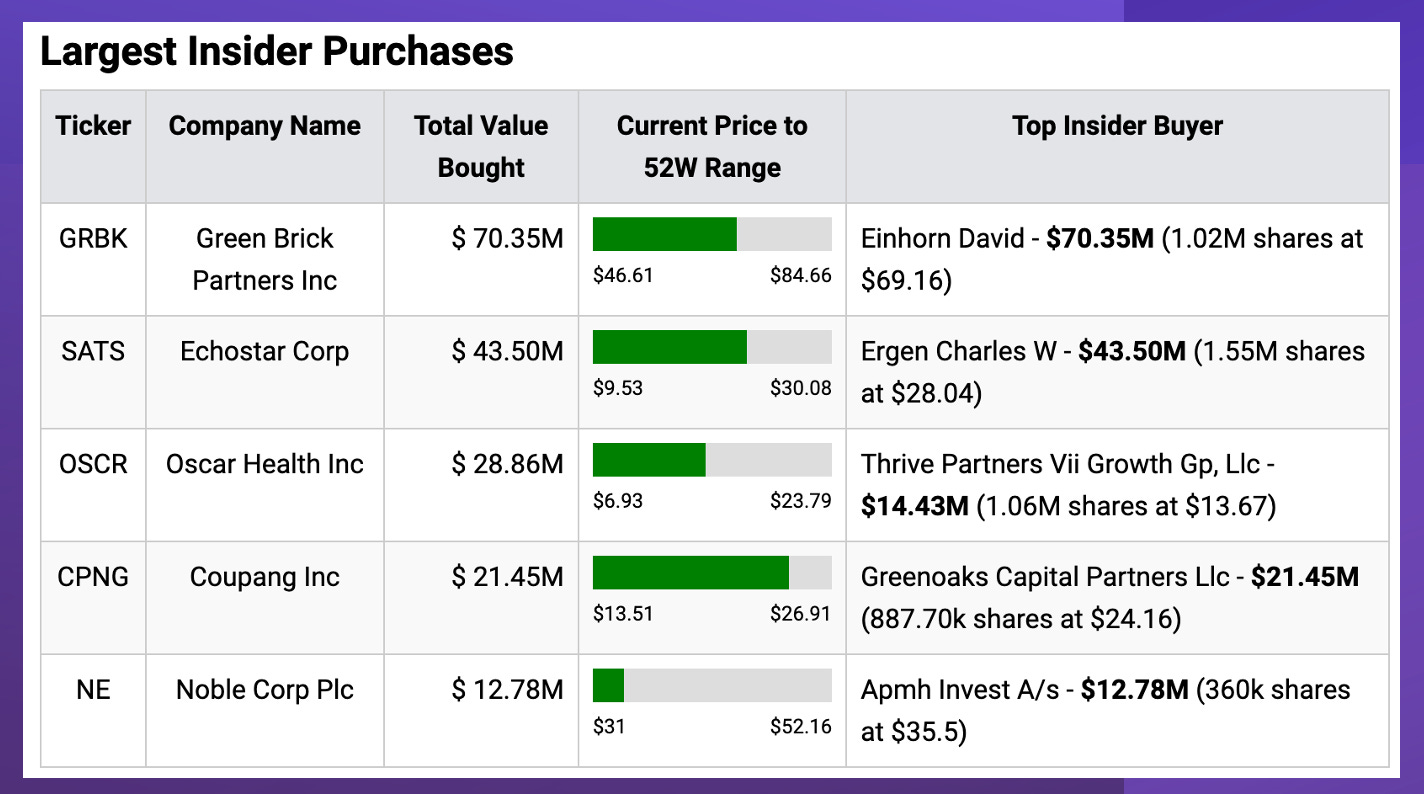
This report tracks the five largest insider buys from the past week and a new ETF in my portfolio — ticker SURE — which tracks insider trading.
SURE is up 4.29% this week, 4.36% this month, and 17.97% YTD.
Insider Stock Highlight
The most interesting stock that was bought this past week was Green Brick Partners (ticker: GRBK). The buyer was David Einhorn, a hedge fund manager at Greenlight Capital. He manages $2.4 billion and his top holdings are GRBK, CEIX, BHF, and HPQ.
Since September 30th, Einhorn has underperformed the SPY index by almost 6% so their recent purchase doesn’t intrigue me much based on their past performance. That being said, my stock ranking system puts the value of the stock at a 9.1/10 and their DCF valuation says the stock is undervalued by around 13%.
In the short term, I think the stock is overvalued, but it has the potential for long-term gains. It has been put on my 🟡 Watch List🟡. For those of you who don’t know, the watchlisted stocks are ones I see as buys, but I don’t have the full conviction to put them in the “Buy” category.
Here are the largest trades from this past week:
Still wondering if premium is worth it? Hundreds of people say that it is — you can join them here:
Executive Trading Report
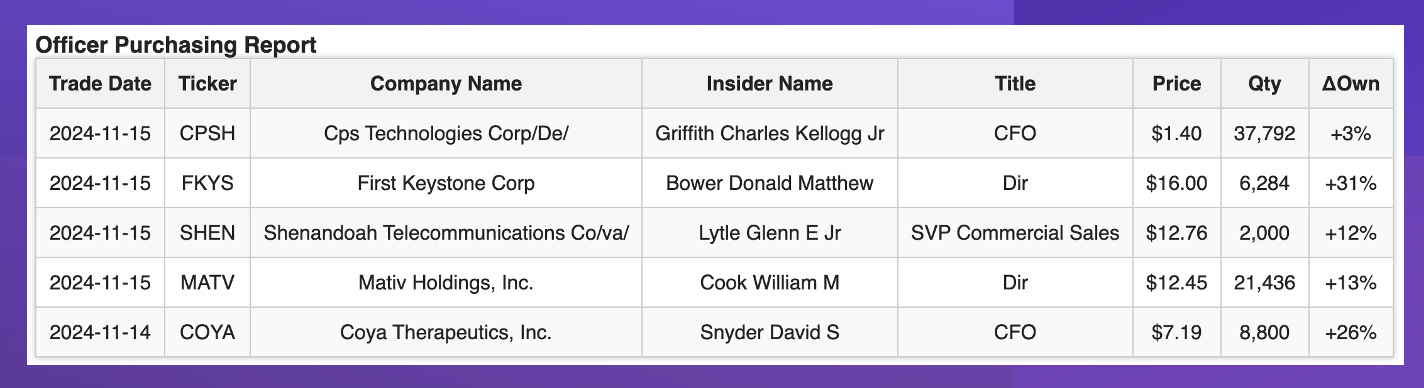
This report tracks the five most recent stock trades from company executives.
Total executive ownership in our top 5 companies grew by over 85%.
The largest increase came from a director at First Keystone Corp (ticker FKYS). They increased their ownership by +31% at a purchase price of $16.
Executive Stock Highlight
The more stunning buy this week, however, came from a director of Mativ Holdings (ticker: MATV). The stock is on a tremendous bearish run and has been for around 3 months (down over 33%). The stock is significantly undervalued right now, my model says the stock is selling at a 35% discount and analysts have the stock undervalued by over 50%.
The problem I have with MATV is its horrendous growth.
3-Year Revenue Growth Rate
2.5%
3-Year EPS without NRI Growth Rate
-35.4%
3-Year FCF Growth Rate
-43.7%
3-Year Book Growth Rate
-5.5%
I think in this instance, the risk doesn’t outweigh the reward. I would need to see a major turnaround in the stock’s financials to indicate a buy opportunity. That being said, given the huge disparity between the stock’s underlying value and price I will put it on the 🟡WATCH LIST🟡. Too risky to constitute a buy from me but a possible opportunity.
Let’s take a look at the other executive trades:
Investing For Next Week
Let’s get into the good stuff. The trades, the buy opportunities, and everything else that has made this happen.
Typically, information like this costs hundreds a month, but you can get it all here (plus more) for $200 annually.
With our current predicted annual returns, a $400 investment in the stock market pays for the subscription! That doesn’t factor in the contrarian trades or the flagship portfolio.

The TLDR Summary
You pay for my research, my time, and most of all the saving of your time. That’s why we have a summary of everything below right here:
🟢The Buys:
Listen to this episode with a 7-day free trial
Subscribe to The Simple Side to listen to this post and get 7 days of free access to the full post archives.


