No Investment Advice or Brokerage; Disclaimer. For the avoidance of doubt, The Simple Side does not provide investment, tax, or legal advice. The value of any asset class can go up or down and there can be a substantial risk that you lose money buying, selling, holding, or investing in any asset. You should carefully consider whether trading or holding assets is suitable for you in light of your financial condition.
Welcome back to The Simple Side — one of the top independent financial newsletters in the world.
If this is your first time here, welcome! If you’re one of the nearly 300,000 returning subscribers, welcome back — we are glad to have you all!
Also, I would love it if you could tell me what you love, hate, and want to see added to this newsletter by clicking the button below. This lets me know how I can improve your reading experience!
Last week I saw three major requests come through on the survey:
Coverage of gold and gold ETFs.
An Abbreviated Buffett Pick of the week
Daily stock picks with ranges to buy along with fundamental and technical analysis
Check my daily newsletter (click here so subscribe).
and I was asked three great questions
How do I enter into the giveaways we are doing?
Explain all of the portfolios and their differences (i.e what is the difference between the Flagship Fund, the weekly trades, and the Contrarian Portfolio).
When will copy trading be released?
Let’s talk about all of this now!
If you want to skip to the newsletter, just scroll on down to the “Today’s Newsletter” section!
The Three Requests
Coverage of a Gold ETF
Okay, consider this done. For now, I am going to put this section in after we cover politician and insider trading!
An Abbreviated Buffet Pick of The Week
Consider this done too. I am going to add this after the Gold ETF coverage. To fit all of this into the newsletter, I am going to shorten some things down. Let me know if things get too short and you want to see more in-depth updates.
Daily Stock Picks
I am not really in the business of sending daily stock picks here on The Simple Side. I do, however, have a daily newsletter that caters to this style of trading. It is called “The Simple Side Daily” and can be found HERE. I will look at adding more fundamental and technical analysis to all of these picks.
The Three Questions
How Do I Enter Giveaways?
If you are a paying subscriber, you are automatically entered into every giveaway! There is nothing you have to do to enter. Sometimes I will offer incentives to get more entries by getting new people to subscribe, but that will be stated specifically in newsletters!
Explain All Of The Portfolios
I will write an article dedicated to explaining this further, but I will do it quickly for now.
The Flagship Fund is our main portfolio and is supposed to be the “Steady—Eddie” growth portfolio. It is built to outperform the portfolio your financial advisor makes for you and the market. We have the receipts to prove it too. Financial advisors average a 5% — 7% returns annually. That is less than the S&P 500 at 8% — 12% annually and less than Buffett at 19.8% annually. Now I have only been tracking my portfolio returns since 2020 and I had the post COVID bump to help me, but the Flagship Fund averages 39.15% a year.
The Contrarian Portfolio is a much riskier, and much higher return portfolio. The investments are sporadic in nature and go somewhat against the grain. For example, when everyone was buying AI hype I recommended buying Uranium and energy stocks. Some of these stocks are up 50% YTD. This group of stocks is attractive to risk seeking investors.
Finally, the Weekly Picks. These picks are what get sent out in this newsletter. They don’t really fit in with my other investment thesis, so why do I do them? Well, these weekly picks help me to stay in-tune with the market and it’s movements. I needed a way to prove to subscribers and myself that I know markets, how to manipulate them, and how to make profit from them. That is exactly what I have done!
With these three differing portfolios and strategies, it let’s investors pick and choose what they want to be invested in and adjust their risk appetite to match! If this doens’t make sense, fill out the form and ask for a better explanation and I will get one made!
When Will Copy Trading Be Released?
This is harder to answer because it doesn’t rely on me. I have signed all of the documents I needed to sign. I have done everything necessary to set up the partnership, and the company I am working with needs to send me the code for you all to sign up with. This will give you all discounts on the platform and allow you to copy my portfolios. Once I have this code, I will share it with you all and we will go from there.
Whew… that was a lot! I wanted to type all of that out to show you that I am paying attention and I am working furiously on making this platform better for you all. Please fill out the survey and let me know what you want to see updated, changed, added, etc! I want to make this your favorite newsletter!
Today’s Newsletter
FREE CONTENT
Quick Updates
Weekly Trades Performance
YTD Returns are over 9% now
Weekly Politician Trading Report
Weekly Insider Trading Report
Gold Report
Buffet’s Pick Of The Week
Portfolio Updates
Key Updates Related To My Contrarian Bets Portfolio (75% YTD)
PAID ACCESS ONLY — Thank you so much for all the support!
Stock Buy Summary
These picks that have returned +10.24% YTD.
Mergers & Acquisitions Stocks
Top Stock Investment Ideas
Micro Cap Stock Picks
Earnings & Options
Quick Updates
Subscriber Giveaways are back!! Last year, we gave away over $4,000 to subscribers here and we want to do it again this year!
Will will be giving away items from our shop (click here) and $2,000 to a paying subscriber! There is nothing you have to do to enter but join our paid subscriber list (use the coupon button below)!!
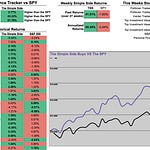
Reminder: paying subscribers have access this spreadsheet with all of our trades and their returns.
Here is what the dashboard looks like!
We will soon be shifting the newsletter over to a custom website for ease of use! You can already see politician and insider trades being tracked there.
If you want to setup a free account now, do so below. I will upgrade paying subscribers for free soon!
Weekly Trades Performance
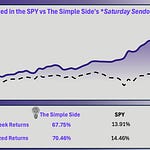
This section of the newsletter tracks the past performance of this weekly newsletter. As you will see, on average we have outperformed the S&P 500 from Monday to Friday, market open to market close.
The graph shows the growth of a $10K investment which began on July 20, 2024. You can find every newsletter dating back to July 20th here by CLICKING HERE.
Here is a summary of the past few weeks of performance and a comparison of returns that this newsletter has had relative to the SPY.
If you haven’t joined already, you can click this button below to join the paid newsletter and get these weekly picks sent to your inbox every Saturday!
Politician Trading Report
Politician trading matters… a lot. In 2024, the top-gaining politician was republican David Rouser who returned 104.1% — followed closely by democrat Pelosi who returned 70.9% over the year.
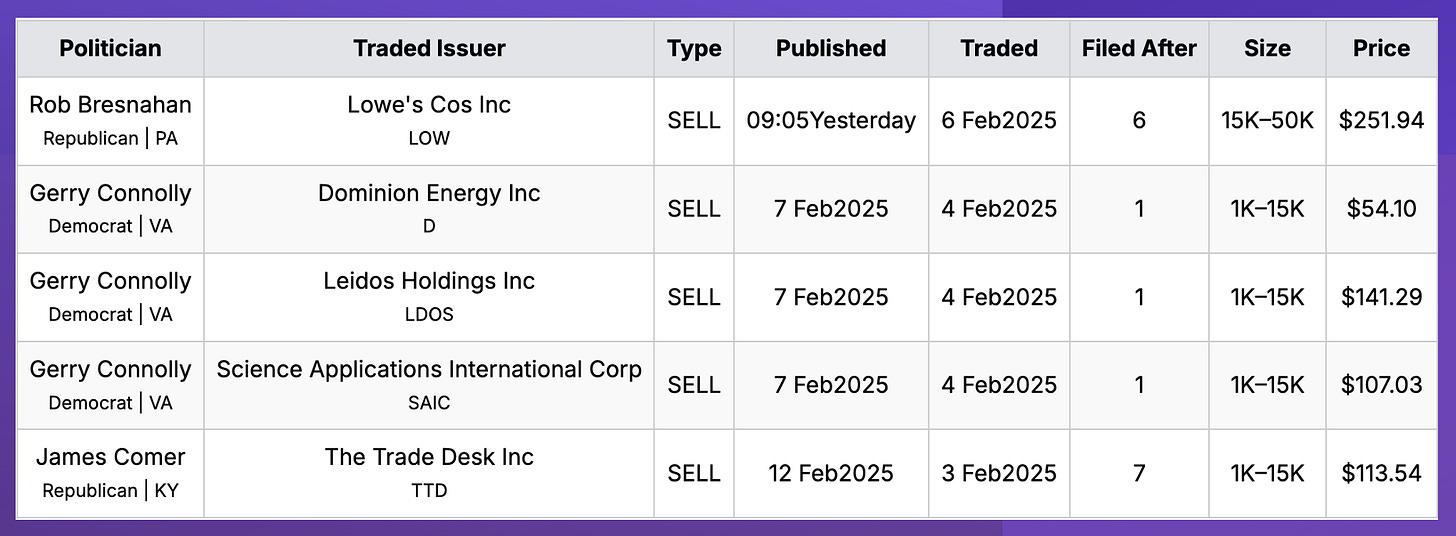
This report tracks the five most recent politician trades and two large holdings in my portfolio — ETFs NANC 0.00%↑ (which tracks democrat trading) and KRUZ 0.00%↑ (which tracks republican trading).
NANC was up 1.11% this week, 4.67% this past month, and 6.24% YTD.
KRUZ is down 0.52% this week, 1.57% this past month, and 4.39% YTD.
Over the past 30 days, 20 politicians made 735 trades with a total trade volume of $14.65 million.
Politician Stock Highlight
Currently, the politician buy/sell ratio is 0.17 which shows pessimism from politicians.
The most interesting trade this week comes from James Comer, who sold shares of The Trade Desk (TTD). His decision to offload TTD stands out because, despite the company’s high P/E ratio (over 100) and short-term volatility, many analysts still expect a significant upside—over 40%.
The Trade Desk has become known for its potential in digital advertising software, yet Comer's move raises questions about whether he’s rotating out of high-growth tech or simply locking in gains. I'm keeping a close eye on TTD, because while growth stocks may feel frothy at these multiples, there’s often a compelling reason behind strong analyst enthusiasm and insider sentiment.
Here are the most recent politician trades:
Insider Trading Report
This report tracks the five largest insider buys from the past week and a new ETF in my portfolio — ticker SURE — which tracks insider trading.
SURE is up 0.39% this week, up .09% this month, and 2.36% YTD.
The monthly buy/sell ratio is currently 0.22 which is below the average of 0.40 and lower than last week’s ratio of 0.29. This indicates a slight sell from insiders in the markets.
Insider Stock Highlight
This week, we turn our focus back to TKO Group Holdings Inc, which has captured investors’ attention yet again thanks to Silver Lake West Holdco, L.p. buying $68.13 million worth of shares at $174.49 each.
With TKO currently trading at $175.50—close to the top of its 52-week range of $78.69 to $179.09—the stock has shown a notable uptick of +0.58% on the day, reflecting strong market sentiment.
Although the company’s operating margin sits at 8.78%, TKO boasts considerable momentum: its 1-Year Price Index rose 63.44%, and it’s seen impressive 12-1 month momentum of +20.53%. Analysts rate TKO as “Outperform,” suggesting further potential growth as more investors take notice of the company’s significant insider commitment and robust share performance.
Here are the largest trades from this past week:
Our premium subscribers get access to long-term, mid-term, and short-term strategies that all beat the market. You can too, join now!
The Gold Tracker
**NEW**
Technical
Gold is trading near $2,935 and remains in a strong uptrend despite overbought indicators. The first layer of support is at $2,919, followed by $2,909 and $2,890. A sustained drop below $2,890 could trigger a deeper correction toward the $2,790 area. On the upside, $2,938 and $2,948 are immediate resistance levels; a break above $2,950 could open the door toward $3,000.
Fundamental
Geopolitical tensions persist after President Trump’s signing of a reciprocal tariff order, pushing investors toward safe-haven assets. While implementation may take weeks, the uncertainty boosts Gold’s appeal alongside a weaker US Dollar, which has struggled amid mixed economic signals.
Traders await the latest US Retail Sales data for short-term direction; a disappointing print would reinforce the flight to Gold, whereas stronger-than-expected numbers could see the US Dollar bounce.
Scenarios & Strategy
A bullish continuation may unfold if safe-haven demand stays elevated and if the Dollar weakness persists, with buyers likely eyeing $2,950 and potentially $3,000.
A sideways scenario could emerge if economic data and trade headlines remain inconclusive, keeping Gold bound between roughly $2,910 and $2,950. A more pronounced pullback might occur if positive developments on trade or stronger US data revive the Greenback, pressuring Gold down toward $2,890.
In the short term, buying dips looks appealing while the price remains above key supports, but keep watch for sudden sentiment shifts around macro headlines.
The Buffett Buy Weekly Summary **NEW**
Every week we send out an analysis on a stock that fits the formula that Berkshire uses to buy stocks. This analysis comes out on Wednesday, and per subscriber requests, we are going to send a simplified version here, enjoy!
CACI International Inc (NYSE:CACI) is a long-standing provider of critical IT solutions for U.S. government agencies, boasting nearly 100% of its revenue from stable federal contracts. This focus on national security and modernization not only creates predictable cash flows but also serves as a strong competitive moat, thanks to high switching costs and long-term government relationships.
Analysts are broadly positive, with a one-year consensus price target implying significant upside—up to +43%—while a more conservative intrinsic valuation from the article suggests around +25%.
From a Buffett-style perspective, CACI checks several boxes: a clear, understandable business model, proven earnings stability, an economic moat through entrenched government ties, and prudent if somewhat tight debt management (though its low cash-to-debt ratio stands out as a key risk).
Valuation metrics—P/E, P/B, and P/S—appear modest, and both DCF and earnings-based models signal potential undervaluation.
Overall, CACI offers a compelling mix of steady government-backed revenue, durable competitive advantage, and reasonable pricing. The main caution is the government’s current cost-cutting climate, which could hit IT budgets. Even so, the general preference for “set-and-forget” outsourcing in IT indicates CACI is well-positioned for long-term growth.
Portfolio Updates
All our portfolios have been outperforming the SPY which is only up 3.45% YTD.
Our flagship portfolio remains strong at 5.99% returns YTD.
The contrarian trades portfolio has remained strong with 39.38% returns YTD. Our portfolio leader (which makes up half the portfolio) up over 145% YTD. I expect these returns to continue, but am actively watching the stock looking to exit with total returns sitting at over 240% from our initial buy in 2024.
The weekly stock picks remain a good solution for anyone who is paying close attention to the markets daily — returns sit at 11.23% YTD. The market remains volatile which makes these picks continually valuable. We are able to capture the premiums from stocks running high while capping individual losses at -1%.
Key Portfolio Updates: Contrarian Trades Portfolio
I am actively looking to exit my HIMS position with over 240% returns. I believe the stock still has room to run, but strict regulatory environments can be brutal to a stock like HIMS. I am searching for new investments and will keep you updated on developments on this front.
Next Week’s Trades
The TLDR Summary
Listen to this episode with a 7-day free trial
Subscribe to The Simple Side to listen to this post and get 7 days of free access to the full post archives.


