No Investment Advice or Brokerage; Disclaimer. For the avoidance of doubt, The Simple Side does not provide investment, tax, or legal advice. The value of any asset class can go up or down and there can be a substantial risk that you lose money buying, selling, holding, or investing in any asset. You should carefully consider whether trading or holding assets is suitable for you in light of your financial condition.
If this is your first time here, welcome! If you’re one of the nearly 300,000 returning subscribers, welcome back — we are glad to have you all!
Before we get into today’s newsletter I want to hear from you… yes you! Every newsletter I send has this quick survey you can use to request changes to the newsletter. Fill it out!
This week I have a few more requests that I would like to highlight. These are direct quotes from subscribers on the form. I am going to answer all of these requests as well!
A reliable stock/ETF scanner add on.
Ask and you shall receive! I am developing a stock scanner now. I plan building a system that ranks stocks in their respective industries. I have developed a few test systems, but coding the rankings properly is taking me a long time. It is on the way!
NEXT REQUEST
I frequently trade options, so I would benefit greatly if you could include a section on options, whether it is education or trades or anything related to options trading. Secondly, a short paragraph on market outlook would be great.
I will be adding a quick market overview at the beginning of the podcasts now!
I have added a bit more insight into the Options & Earnings Section at the very bottom of the newsletter! I will look into adding an education section to the newsletter. I worry about the newsletter getting too long. I might make a separate newsletter and do an “educational” day where I explain a certain aspect of the markets like options. If you like this idea, let me know in the comments, or restack this post and tell me you like or don’t like the idea!
NEXT REQUEST
Insider stock buying more detail. More on options strategies that are reliable for extra income ( in retirement). Strategies that are not so complicated and hard to understand. Something for a $20k or so trading account to generate approx. $750-1000 per week.
I will look at adding more detail to the insider stock purchases. For now, I will highlight the past buying and selling of the insiders.
Generating an extra 1000 a week means you’ll make returns of over 200% annually. I don’t think this is possible, and if someone is telling you that it is, they are lying or they are the richest man in the world. I will look at adding this to my educational series as mentioned above. Again, if you do or don’t like this comment and tell me, restack and tell me, or email me @ thesimplesidenews@gmail.com
NEXT REQUEST
Love The Simple Side. Is there a lifetime subscription level of membership available?
Yes, we actually do have a lifetime membership. We typically only offer lifetime memberships on request, and we price the membership to be worth 10 years of subscriptions. FOR A LIMITED TIME AND LIMITED TO 5 SLOTS ONLY, we will be offering a 50% discounted lifetime subscription. The price will be dropped from the typical $2,000 all the way down to $1,000.
This will give you instant access to our copy trading, our website, our giveaways, and our newsletter FOREVER.
PAID ACCESS ONLY — Thank you so much for all the support!
Stock Buy Summary
Mergers & Acquisitions Stocks
Top Stock Investment Ideas
Micro Cap Stock Picks
Earnings & Options
Quick Updates
We released our beta test of copy trading to a few paying subscribers last week and it went extremely well! I will be reaching out to more paying subscribers over the next couple of weeks to give you continued access to our copy trading system! Thank you — to the few of you who created accounts on the platform and put capital on the platform as well!
Subscriber raffles are back!! Last year, we gave away over $4,000 to subscribers here and we want to do it again this year!
If you are a paying subscriber, be on the lookout for an upcoming email about our next $2,000 dollar raffle!!
Reminder: paying subscribers have access this spreadsheet with all of our trades and their returns.
Here is what the dashboard looks like!
We will soon be shifting the newsletter over to a custom website for ease of use! You can already see politician and insider trades being tracked there.
If you want to setup a free account now, do so below. I will upgrade paying subscribers for free soon!
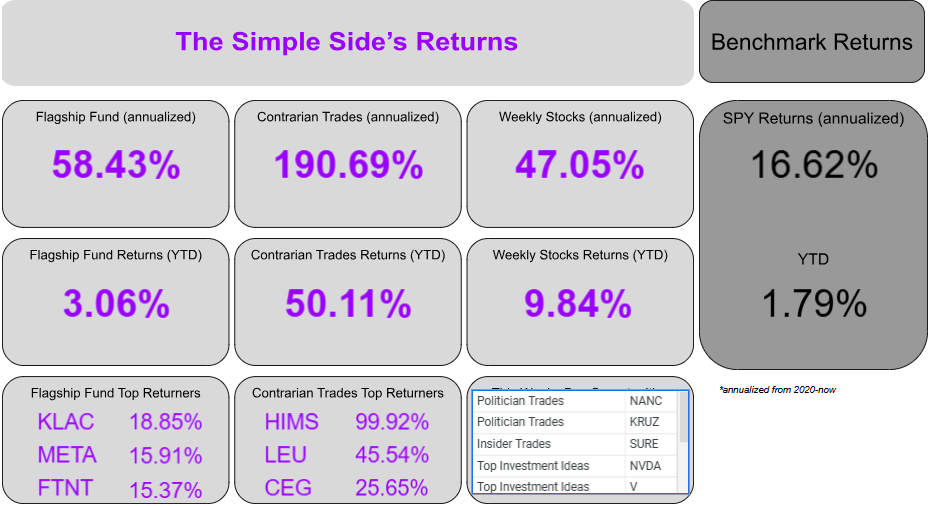
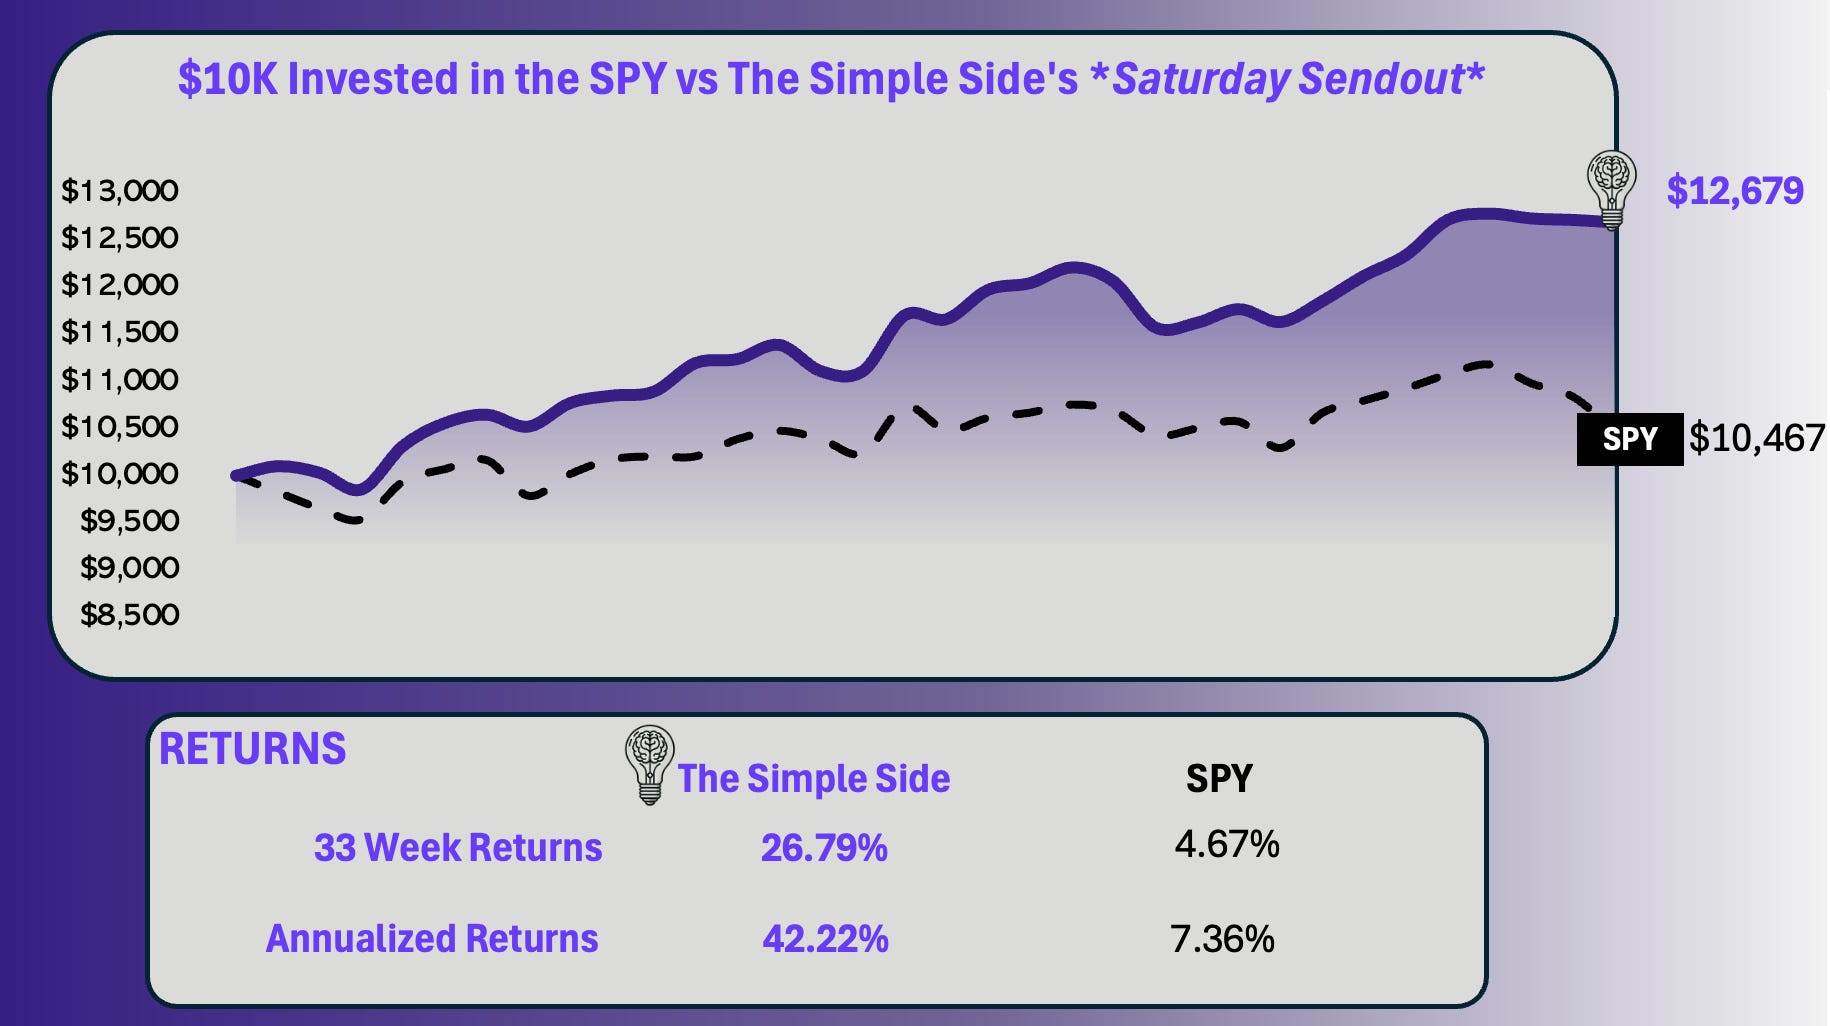
This section of the newsletter tracks the past performance of this weekly newsletter. As you will see, on average we have outperformed the S&P 500 from Monday to Friday, market open to market close.
The graph shows the growth of a $10K investment which began on July 20, 2024. You can find every newsletter dating back to July 20th here by CLICKING HERE.
Here are the current performance metrics:
If you haven’t joined already, you can click this button below to join the paid newsletter and get these weekly picks sent to your inbox every Saturday!
Overall, the market doesn’t show signs of slowing its decent into oblivion — well, maybe not oblivion — but I have to keep readers hooked somehow. The biggest companies in the world have been struggling in 2025, which is likely why we are seeing poor performance in the market as a whole. MSFT, NVDA, AAPL, AMZN, and GOOGL are all losers, while Mark and Meta remain victorious, with a 6.86% return YTD.
I guess CEOs who wakeboard are the killers in the market now.
You probably saw the article I sent this week highlighting why I am unsurprised by the downturn of the markets — lots of “dumb” money. The markets have been full of speculation for the past 4 years, and speculation can only last so long before fundamentals begin to take over.
High inflation, low consumer spending, and the government ruffling feathers across the globe is leading to uncertainty in the markets and everyone is feeling it. I suspect that markets will remain increasingly volatile until some good news comes from Washington.
I will be looking for positive updates about the two main wars in Ukraine and Israel as these could restore confidence in investors. If we have good news and see no response in the S&P then we may be in for a rough 2025.
Politician Trading Report
Politician trading matters… a lot. In 2024, the top-gaining politician was republican David Rouser who returned 104.1% — followed closely by democrat Pelosi who returned 70.9% over the year.
This report tracks the five most recent politician trades and two large holdings in my portfolio — ETFs NANC 0.00%↑ (which tracks democrat trading) and KRUZ 0.00%↑ (which tracks republican trading).
NANC was down 4.84% this week, 8.27% this past month, and down 3.58% YTD. KRUZ is down 3.97% this week, 6.07% this past month, and down 1.51% YTD. Both indexes are underperforming the SPY year to date, down only 1.49%.
Over the past 30 days, 16politicians made 150 trades with a total trade volume of $22.40 million. The buy/sell ratio is now 2.27, which shows a bullish sentiment from politicians.
Here are the 5 most recent politician trades:
Insider Trading Report
This report tracks the five largest insider buys from the past week and a new ETF in my portfolio — ticker SURE — which tracks insider trading.
SURE is down 0.75% this week, 5% this month, and 1.94% YTD.
The monthly buy/sell ratio is up to 0.24 — higher than last week’s 0.23 — but is below the median of 0.34. This indicates a slightly bearish sentiment from insiders.
Here are the 5 largest trades from this past week:
Here are two interesting transactions from the report above.
David Goeddel
Average Return per transaction: 8.96%
Outperforming Transactions: 60% on 60 trades
TNYA History - 20% of current portfolio - 6 buys & 0 sells - $11 million value
William J Quinn
Average Return per transaction (monthly): 11.35%
Outperforming Transactions: 100% on 1 trade
PR History - 95% of current portfolio - 2 buys & 2 sells - $13 million value
Our premium subscribers get access to long-term, mid-term, and short-term strategies that all beat the market. You can too, join now!
Technical Gold remains firmly above $2,900, supported by a “Strong Buy” signal across multiple technical indicators (RSI, MACD, Moving Averages). The daily chart shows price action comfortably above key moving averages (MA20 at $2,750, MA50 near $2,580) while intraday dips below the 20-SMA quickly attract buyers.
Pivot Point data suggests $2,911–$2,894 as near-term support, with resistance levels at $2,928, $2,941, and $2,956. Despite a slightly lower high and low in the short term, the prevailing momentum is bullish.
Fundamental US tariff uncertainties under President Trump continue to shape market sentiment, though an apparent dovish tilt by traders expecting more rate cuts from the Federal Reserve is keeping a lid on the US Dollar.
Meanwhile, mixed US labor data—ranging from weekly unemployment claims to the anticipated February Nonfarm Payrolls—keeps investors cautious, propping up the appeal of safe havens like Gold.
Elsewhere, periodic dips remain well-bid on concerns of trade disruptions, geopolitical developments, and shifting monetary policy expectations.
Scenarios & Strategy A continued pullback in the Dollar, or fresh geopolitical tension, could send Gold higher toward $2,941–$2,956 resistance.
If risk sentiment improves significantly, profit-taking may drive XAU/USD down to the $2,900 mark or even $2,894 support. Overall, dips are likely to attract buyers, reinforcing the broader uptrend.
Short-term traders might use near-term supports (particularly $2,911–$2,894) as entry zones, while long-term holders can remain positioned for potential upside toward $2,956 and possibly new highs if fundamental catalysts align.
The Buffett Buy Weekly Summary
This Week, We Are Looking At Our “Dumb Money” Article From This Week
This week's article focused on the concept of "dumb money" and its impact on financial markets. Here are the key points discussed and why each matters:
COVID-Era Investing Surge: Retail investors flooded the market due to stimulus checks, causing inflated valuations without fundamental analysis, exemplified by risky investments in stocks like Tesla and Nvidia. These stocks are now significantly off their highs.
Increased Risk Through Leverage: Investors have piled on nearly $1 trillion in margin debt, magnifying both potential gains and losses. High leverage means increased market volatility and greater financial risk.
Market Overvaluation: Using Buffett's valuation indicator, the market is significantly overvalued by approximately 80%, indicating increased vulnerability to downturns.
Persistent Inflation and Economic Pressures: Inflation remains elevated due to external factors like tariffs and global issues, adding further stress to the economy and potentially impacting investment returns.
How I'm Hedging My Portfolio: I'm managing risk carefully by moving into safer investments, particularly bonds, as a hedge against market volatility. I'm also exploring other defensive strategies, including commodities and conservative stock selections, to position my portfolio safely for potential downturns
Portfolio Updates:
Copy Trading I would like to thank the 5 beta testers again for helping with the release of the copy trading launch, especially PKS who was extremely helpful with his feedback! I will be releasing copy trading to more paying subscribers soon — emails to come this week!
Flagship Fund Updates Our Flagship Fund is performing in line with expectations. We are still outperforming the market by about 1%. While YTD the fund is down, we expect to see stabilized returns over the next couple of months with our ZROZ hedge.
We strategically removed NVDA out of the portfolio for 2025 and this has proved to be a great move as the stock is down nearly 19% YTD. We do have one sour apple in the portfolio: ANET. The stock is down 25% YTD and started the year with a 7% weighting in the portfolio. Based on current ROIC — WACC levels, I still like the stock and the poor returns this year present a buying opportunity. I am looking to shift capital from GOOG into ANET.
Second Hand AI Effects Portfolio Overall, this portfolio is down YTD, however, this isn’t a short term portfolio. These “bets” are 5-10yr plus holding periods. Investor capital will eventually pour into these stocks. I am just waiting for the mainstream media to begin their massive coverage of the energy issues that AI will eventually cause. That is when we will begin to see returns here.
Weekly Trades Limiting our weekly trade losses to 1% has proved to be extremely beneficial. The SPY has averaged a -2.16% return over the past 3 weeks where we have mitigated losses and hold at -0.24%. Overall, we are extremely happy with this performance.
Paying subscribers, all of your info and analysis is below! Enjoy and I will see you all next weekend. Look for educational emails, and copy trading announcements coming in this week.
The Saturday Sendout is tradeable market news in one place. Get weekly financial information on insider, company executive, and politician trading plus tons of other insights.
The Saturday Sendout is tradeable market news in one place. Get weekly financial information on insider, company executive, and politician trading plus tons of other insights.