No Investment Advice or Brokerage; Disclaimer. For the avoidance of doubt, The Simple Side does not provide investment, tax, or legal advice. The value of any asset class can go up or down and there can be a substantial risk that you lose money buying, selling, holding, or investing in any asset. You should carefully consider whether trading or holding assets is suitable for you in light of your financial condition.
If this is your first time here, welcome! If you’re one of the nearly 300,000 returning subscribers, welcome back — we are glad to have you all!
Before we get into today’s newsletter I want to hear from you… yes you! I want to know what could make this newsletter better for you!
Click that survey button below and let me know now!
Key sale in My Contrarian Bets Portfolio (50% YTD)
PAID ACCESS ONLY — Thank you so much for all the support!
Stock Buy Summary
Mergers & Acquisitions Stocks
Top Stock Investment Ideas
Micro Cap Stock Picks
Over 30% returns YTD
Earnings & Options
Quick Updates
Subscriber raffles are back!! Last year, we gave away over $4,000 to subscribers here and we want to do it again this year!
Will will be giving away items from our shop (click here) and $2,000 to a paying subscriber! There is nothing you have to do to enter but join our paid subscriber list!!
Reminder: paying subscribers have access this spreadsheet with all of our trades and their returns.
Here is what the dashboard looks like!
We will soon be shifting the newsletter over to a custom website for ease of use! You can already see politician and insider trades being tracked there.
If you want to setup a free account now, do so below. I will upgrade paying subscribers for free soon!
This section of the newsletter tracks the past performance of this weekly newsletter. As you will see, on average we have outperformed the S&P 500 from Monday to Friday, market open to market close.
The graph shows the growth of a $10K investment which began on July 20, 2024. You can find every newsletter dating back to July 20th here by CLICKING HERE.
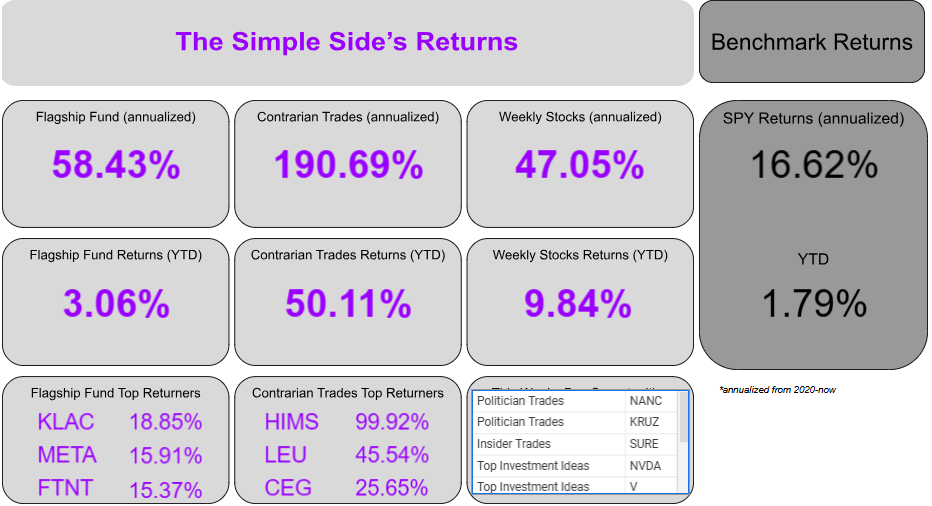
Here are the current performance metrics:
If you haven’t joined already, you can click this button below to join the paid newsletter and get these weekly picks sent to your inbox every Saturday!
Politician trading matters… a lot. In 2024, the top-gaining politician was republican David Rouser who returned 104.1% — followed closely by democrat Pelosi who returned 70.9% over the year.
This report tracks the five most recent politician trades and two large holdings in my portfolio — ETFs NANC 0.00%↑ (which tracks democrat trading) and KRUZ 0.00%↑ (which tracks republican trading).
NANC was down 2.69% this week, 1.63% this past month, and up 2.63% YTD. KRUZ is down 0.88% this week, 1.81% this past month, and up 3.17% YTD. Both indexes have outperformed the SPY YTD.
Over the past 30 days, 20politicians made 246 trades with a total trade volume of $6.08 million. The buy/sell ratio for these trades is 1.83 meaning bullish sentiment from politicians.
Here are the most recent politician trades:
Insider Trading Report
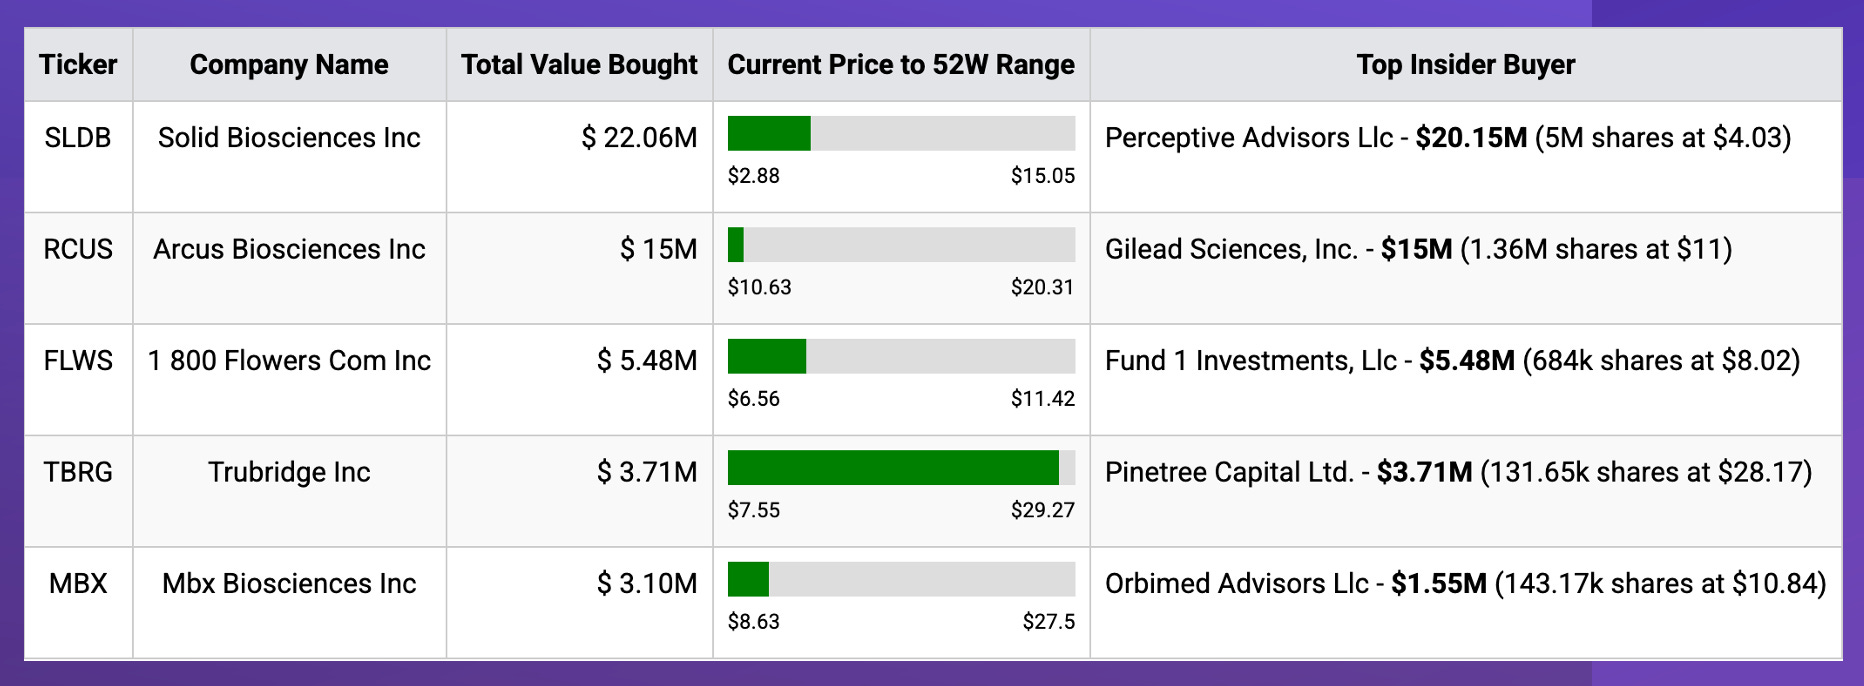
This report tracks the five largest insider buys from the past week and a new ETF in my portfolio — ticker SURE — which tracks insider trading.
SURE is down 1.75% this week, down 3.41% this month, and up 1.29% YTD.
The monthly buy/sell ratio remains at 0.22 which is below the median of 0.34. This indicates a slightly bearish sentiment from insiders.
Here are the largest trades from this past week:
Our premium subscribers get access to long-term, mid-term, and short-term strategies that all beat the market. You can too, join now!
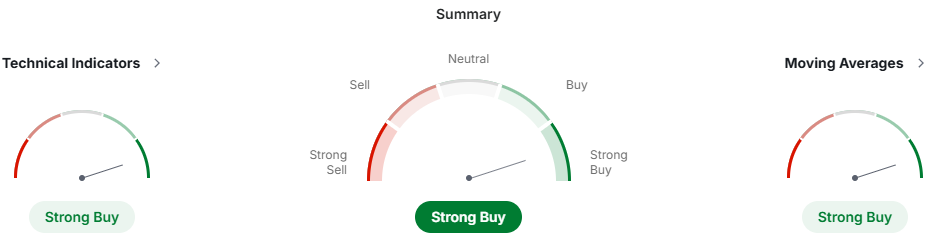
Technical Indicators For The Traders Gold is anchored around $2,930 after pulling back from its all-time high above $2,950 on Thursday. Despite the retreat, the underlying trend remains positive. The first support sits at $2,923, followed by $2,908; a clear break below these levels would signal a deeper correction.
On the upside, the $2,939 pivot is key to regaining momentum, with the next hurdles at $2,954 and $2,969. A sustained push above $2,950 would leave the $3,000 mark within reach.
Fundamental Indicators For The Nerds The precious metal’s slip from record highs coincided with a modest pickup in US Dollar demand and mixed macro data out of Europe. Meanwhile, US yields have edged lower, limiting Gold’s downside.
Uncertainty remains regarding US sanctions on Russia, and the market awaits the US preliminary PMI figures to gauge economic sentiment. Across the Atlantic, Germany’s weekend election could reshape US-Europe relations in the long run, indirectly affecting the demand for safe havens.
Positive corporate news from Chinese gold firms underscores continued support for the broader metals sector.
Scenarios & Strategy If the Dollar stays under pressure and yields remain subdued, Gold may resume its climb toward recent highs. A close above $2,939 will be an early sign of renewed bullish momentum, potentially targeting $2,954 and beyond.
Alternatively, stronger-than-expected US data or a surprisingly hawkish turn in US policy could prompt further profit-taking, with $2,923 and $2,908 as next lines of defense. While short-term dips could offer tactical buying opportunities, traders should keep an eye on German election outcomes and any progress on sanction talks for potential shifts in market sentiment.
Iron Mountain (IRM) Summary Iron Mountain is a record-management giant that started out storing documents in a limestone mine and has since grown into a major provider of secure physical and digital data services, generating over $6 billion in annual revenue.
Beyond its origins in paper storage for government agencies and big businesses, IRM now runs data centers and offers cloud solutions—giving it a competitive moat that blends physical and digital security.
However, while many analysts foresee a strong upside (with some targeting as high as $140 per share), a deeper look at IRM’s fundamentals tells a more cautious story. The company carries high debt, has a below-target return on invested capital relative to its cost of capital, and appears overvalued according to my models (fair value at around $79).
Despite all-time highs in revenue and a growing data center business, these leverage and valuation concerns keep me on the sidelines—for now. In short, Iron Mountain’s long-term prospects for digitization and cybersecurity look promising, but its financial structure lowers its near-term appeal, making it a “watchlist” candidate rather than a buy at the moment.
Also, a major issue is that one of its biggest customers… the USA is cutting costs and these losses look like they could hit the books of IRM sometime soon.
Portfolio Updates
All our portfolios have been outperforming the SPY which is only up 1.79% YTD.
Our flagship portfolio remains strong at 3.06% returns YTD.
The contrarian trades portfolio has remained strong with 50% returns YTD. Our portfolio leader (which makes up half the portfolio) up over 99% YTD down for the 148% last week. I mentioned last week we were looking to exit and have done so. More info below.
The weekly stock picks remain a good solution for anyone who is paying close attention to the markets actively — returns sit at 9.84% YTD. The market remains volatile which makes these picks continually valuable.
Last week I was “actively looking to exit my HIMS position” with over 240% returns and good ‘ole Novo Nordisk has given me the green light.
Part of what made HIMS so valuable was their development of GLP-1 compounds. This ability for them to sell their generic compound ended abruptly on Friday when the FDA announced that Ozempic was no longer in short supply.
This means that companies like HIMS can no longer make the generic compound, nor can they continue to sell it… well kinda.
The FDA’s announcement doesn’t immediately stop HIMS from selling the compound. They are allowed to continue to meet patient needs for the time being, but the clock is now ticking for HIMS.
In reality, subscribers who bought this stock with me in 2024 are realizing returns of nearly 200% with the current price, and even after the 25% drop on Friday.
The stock still does have room to run and it has the legs to do so. Their website traffic jumped 650% after their Superbowl advertisement, they bought a facility to manufacture their own compound, and future shortages mean more time for HIMS to navigate the regulatory environment.
Nonetheless, I would be a fool to risk the 200% returns I currently have. I am looking at exiting around 80% of my position. The 20% that remains will be a bet on HIMS's creation of their own GLP-1 and their ability to distribute it accordingly.
The Saturday Sendout is tradeable market news in one place. Get weekly financial information on insider, company executive, and politician trading plus tons of other insights.
The Saturday Sendout is tradeable market news in one place. Get weekly financial information on insider, company executive, and politician trading plus tons of other insights.