


No Investment Advice or Brokerage; Disclaimer. For the avoidance of doubt, The Simple Side does not provide investment, tax, or legal advice. The value of any asset class can go up or down and there can be a substantial risk that you lose money buying, selling, holding, or investing in any asset. You should carefully consider whether trading or holding assets is suitable for you in light of your financial condition.

Good morning, simple investor! See below for some quick updates before we get into this week's returns — which outperformed the S&P 500 again!
Quick Updates
THE $2,000 GIVEAWAY WILL HAPPEN NEXT WEDNESDAY!
If you like quick, short-form stock updates and analysis daily, check out my daily newsletter (only costs $10 a year or $1 a month).
I am currently working with a brokerage allow paying subscribers to copy my exact portfolios without making any trades! Just buy the portfolio in one click!
I will be doing a podcast Q&A to answer any and all questions that people have emailed to me or that they have sent to me with the button below!
I will try to release this along with the giveaway next Wednesday!
Feel free to send me an email by replying to this message, or emailing my other email: thesimplesidenews@gmail.com.
You can also click the button below and let me know anonymously about anything!
Past Performance: Averaging 1.09% Weekly
This section of the newsletter tracks the past performance of this weekly newsletter. As you will see, we have (on average) outperformed the S&P 500 from Monday to Friday, market open to market close.

The graph shows the growth of a $10K investment which began on July 20, 2024. You can find every newsletter dating back to July 20th here by CLICKING HERE.

Here is a summary of the past few weeks of performance and a comparison of returns that this newsletter has had relative to the SPY.

If you haven’t joined already, you can click this button below to join the paid newsletter and get these weekly picks sent to your inbox every Saturday!

Today’s Reporting Overview
Politician Trading Report
Politician Stock Highlight
Insider Trading Report
Insider Stock Highlight
Executive Trading Report
Executive Stock Highlight
Investing for Next Week (For Paying Subscribers)
Next Week’s Buy Opportunities
Mergers and Acquisitions
Top Investment Ideas
Contrarian Bets
Flagship Portfolio Updates
Micro-Cap Picks *Updated Format*
Expected Stock Movements From Options Trading *Updated Format*
Politician Trading Report
This report tracks the five most recent politician trades and two large holdings in my portfolio — ETFs NANC 0.00%↑ (which tracks democrat trading) and KRUZ 0.00%↑ (which tracks republican trading).
NANC is up 1.63% this week, 2.53% this past month, and 33.75% YTD.
KRUZ is down 1.40% this week, up 0.61% this past month, and 20.46% YTD.
Contributing to these gains — over the past 30 days — 11 politicians have made 89 trades investing over $18.80 million.
Politician Stock Highlight
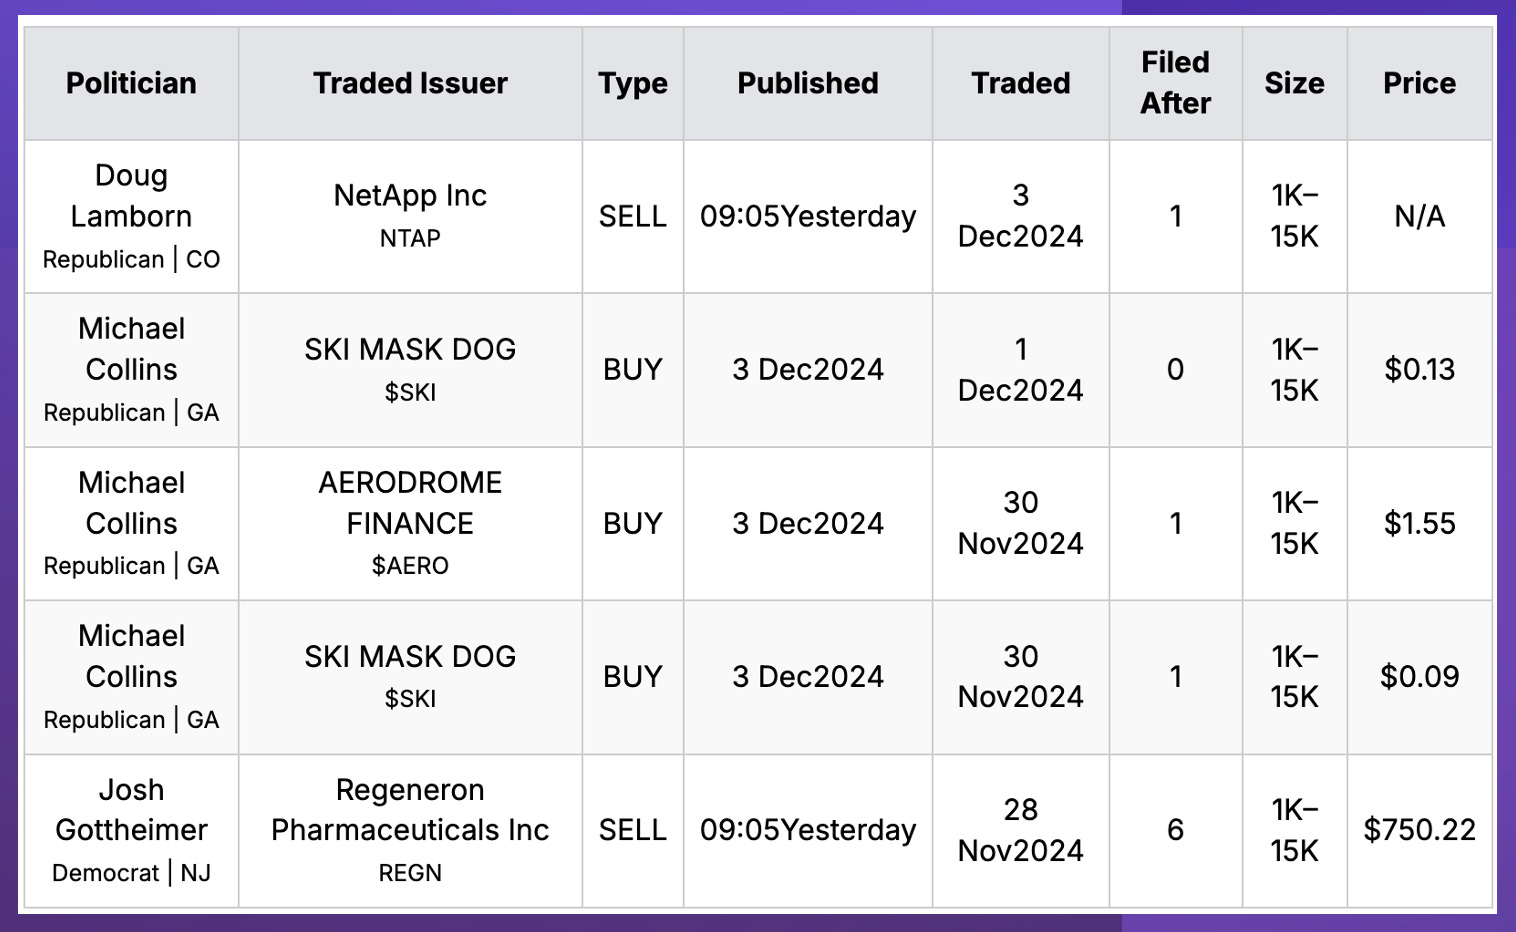
This week marked the end of the Marjorie Greene’s 3 week run of stock buying and I found the most ridiculous politician trade this week. Michael Collins bought a crypto currency called “Ski Mask Dog” on December 3rd and November 30th more than quadrupling his money. I will be paying much closer attention to politician crypto trades so we can capitalize on these trades in the future.
Collins also bought AERO another crypto coin on the 30th of November and this trade also made him 2x to 4x his original investment.
The other two top trades this week were sells for NTAP and REGN. While I think regen is still 8% undervalued, NTAP looks to be heavily overvalued (my models puts the company at 56% overvalued). None of these top 5 coins or stocks this week are ones I would look at buying.
Here are the most recent politician trades:
Insider Trading Report
This report tracks the five largest insider buys from the past week and a new ETF in my portfolio — ticker SURE — which tracks insider trading.
SURE is down 1.58% this week, up 4.18% this month, and 17.85% YTD.
The top 5 insider buyers bought over $23 million worth of stock.
The top 5 insiders sellers sold over $4 billion worth of stock.
Insiders were net sellers this week with a buy:sell ratio of 41:193.
Insider Stock Highlight
PBF topped the charts again this week with a $9.25 million insider buy. The stock is down 51% from its high in April and YTD has lost 31%. I have talked about PBF energy before have stated that after Q4 financials come out I will decide if I want to go long on the stock. This week, I will spare you from hearing me ramble about the same stock and so I will switch to a different insider buy… Red Robin.
Red Robin stock (RRGB) is down 52.75% YTD and is currently at one of the lowest prices the stock has ever been at. Now, my models say the company is 37% overvalued, but analysts say the company has 58% upside. I cannot disagree more with this assumption. The only thing the company has going for it are the insider buys that have happened recently with over 1.8 million shares being bought by 8 insiders over the past 3 months. The company has declining revenue for 5 years, has poor financial strength, and isn’t currently profitable.
Again, nothing here catches my eye for this weeks buying.
Here are the largest trades from this past week:

Our premium subscribers get access to long-term, mid-term, and short-term strategies that all beat the market. You can too, join now!
Executive Trading Report
This report tracks the five most recent stock trades from company executives.
Total executive ownership in our top 5 companies grew by over 29% — one of the highest growth weeks we have had.
The largest increase came from a director at Mind Medicine (MNMD). They increased their ownership by +14% at a purchase price of $7.17 and the stock currently sits at $7.55 a +5.30% change.
Executive Stock Highlight
I want to highlight two of the stocks on this list as 🟡Risk Opportuinities🟡. These are stocks that could be great buys next week, but carry excessive risk. These stocks are 🟡CTGO and 🟡GRNT. I want to do a quick analysis of these companies because they both have opportunities to jump next week based on their current momentum.
Both are relatively newly created public companies who went public in 2020 and 2021 respectively. Sadly, this which means my model doesn’t have enough data give an overvalued or undervalued % score. Analysts, however, say the companies have 156% (CTGO) and 22.53% (GRNT) upside.
My models were able to rank both stocks based on their current and historical growth profitability, financial strength, momentum, and intrinsic value. They scored 3.8/10 (CTGO) and 2.8/10 (GRNT) which is drastically lower than most of the companies I like to invest in.
So, knowing that both companies are risky buys which would I pick for next week?
CTGO’s stock appears primed for a potential price jump next week due to its strong Momentum Rank. It’s low RSI values across the 5-Day, 9-Day, and 14-Day periods (4.57, 10.58, and 16.73, respectively) suggest that the stock is currently oversold, often signaling a rebound as traders look to capitalize on undervalued conditions.
Additionally, the 3-1 Month Momentum % at 9.55 highlights recent strength, which could indicate the early stages of a broader recovery despite weaker long-term momentum metrics.
Let’s take a look at the other executive trades:


You can join the +100 others who have seen our returns go from 0 to this…

Next Week’s Trades
Key Opportunities and Insights
The TLDR Summary
Quick PSA: We treat the trades as buys on Monday’s Market open and sells on Friday’s Market close.
Listen to this episode with a 7-day free trial
Subscribe to The Simple Side to listen to this post and get 7 days of free access to the full post archives.


